Preface
According to the global cancer statistics in 2021, lung cancer
is among the top [1] in both morbidity and mortality. The WHO’s
latest 2021 lung tumor classification classifies adenocarcinoma
in situ and atypical adenomaplasia as precursor lesions, and microinvasive adenocarcinoma and invasive adenocarcinoma are
still classified as adenocarcinoma, which not only provides a
basis for the conservative treatment of adenocarcinoma in situ,
but also greatly reduces the psychological pressure of patients.
At present, the treatment of early lung adenocarcinoma mainly
adopts surgical resection, precursor lesions can take regular follow-up or elective surgery, take elective surgery of precursor lesions and microinvasive adenocarcinoma by sublobectomy can
achieve a good prognosis, while invasive adenocarcinoma needs
to take lobectomy or pulmonectomy to achieve a good prognosis.
Therefore, it is crucial to accurately judge the grade of lesion invasion before surgery.
Materials and methods
Case collection
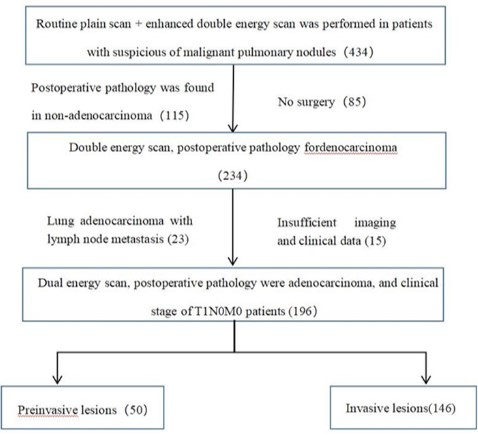
A prospective collection of 196 patients, including 196 lesions.
Inclusion criteria: Patients with primary pulmonary nodules un-
dergoing double-energy scanning.
Exclusion criteria are shown in Figure 1.
Feature extraction
The clinical characteristics and imaging characteristics of the
included patients were extracted, including age, gender, current
active smoking, whether their native place was Yunnan Xuanwei,
and whether there were chest-related symptoms. Imaging features include: quantitative features (longest diameter of lesion,
CT value of lesion flat scan, CT value of single energy image of
enhanced arterial period) and qualitative features (nodule type,
nodule morphology, burr features, clear tumor-lung interface,
vacuolar features, air bronchial features, vascular tract features,
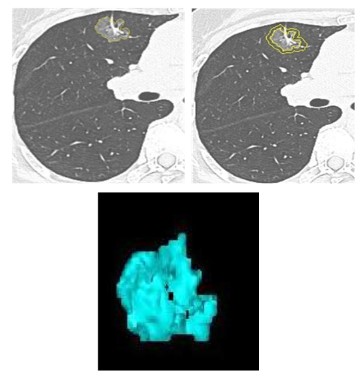
and pleural depression features). Imaging omics features include
the imaging omics features of nodules itself and imaging omics
features within 5 mm range, the delineation of nodules itself as
ROI 1, and then 5 mm range as ROI 2 (using semi-automatic software), extract the imaging omics features of the two regions of
interest (Figure 2).
Model establishment
Manual imaging model established with patient clinical characteristics and manual imaging characteristics, combined with clinical characteristics and imaging omics characteristics, and mixed
model established with clinical characteristics, manual imaging
characteristics and imaging omics characteristics.
Statistical analysis
Statistical analysis of the collected data was performed using
the statistical software R language. Chi-square test or Fisher exact test is used for statistical analysis for the counts data of the
general clinical data and CT images, test for statistical normality
of measurement data for the general clinical data and quantitative characteristics of CT images and use t-test for measurement
data with normal distribution, otherwise, Mann-Whitney U test
is used. LASSO regression and independent predictors, and DE
LONG test was used to compare the diagnostic performance of
the three models.
Results
Baseline characteristics
A total of 196 lesions were included in 196 patients in this
study. The pathological results were: AAH 10, AAH with local AIS
7, AIS 11, MIA 3, AIS with MIA 15, AAH with local AIS with MIA 4,
IA 146, IA in the invasive lesions, and the remaining lesions in the
pre-invasive group. In this study, 84 males and 112 females had
an age range of 34 – 81 years, with a mean age of 54.65 years.
Pre-invasive and invasive lesions were divided into training and
validation set in a ratio of 8:2. Statistically different characteristics
of the training set and the validation sets are shown in Table 1
(see Appendix Table 1 for the full basic features).
Extract the features of the training set and analyze the data
as follows
Clinical risk factor analysis results
Univariate analysis of the patients' general clinical data retained the characteristics of p <0.05, and the results are shown in
Table 2.
Manual imaging feature analysis results
Univariate and multivariate regression analysis of traditional
CT characteristics was retained at p<0.05. In the univariate analysis, as shown in Table 3 (see Appendix Table 2 for the full table)
and Table 4, the nodule morphology, nodule type, pleural traction
and depression showed statistical differences in the qualitative
characteristics, such as the maximum diameter of the nodules
and the lesion CT value.
Table 1: The distribution of statistically significant features in the training set and in the training set and validation set.
| Characteristics |
Overall cohort (n = 96) |
Derivation Cohort (n = 158) |
Validation Cohort (n = 38) |
P Value |
| age |
56.64 ± 9.91 |
54.83 ± 9.8 |
55.15 ± 10.82 |
0.001a |
| The longest diameter |
1.83 ± 0.74 |
1.78 ± 0.76 |
1.86 ± 0.72 |
0.001a |
| Non-contrast CT value |
-178.81 ± 66.60 |
-201.40 ± 74.78 |
-153.78 ± 53.24 |
0.001a |
Table 2: Clinical characteristics Univariate analysis has statistically
significant characteristics.
| Clinical features |
Preinvasive lesions |
Invasive lesions |
p |
| age |
|
49.80 ± 9.12 |
56.41 ± 9.49 |
<0.001 |
| sex |
man |
13 |
59 |
0.055 |
| female |
27 |
59 |
| active smoking |
yes |
6 |
45 |
0.007 |
| no |
34 |
73 |
| Xuanwei native
place |
yes |
10 |
85 |
<0.001 |
| no |
30 |
33 |
Table 3: Statistically significant features in univariate analysis.
| Qualitative characteristics |
Preinvasive lesions |
Invasive lesions |
p |
| Nodular type |
pGGN |
19 |
15 |
<0.001 |
| mGGN |
11 |
43 |
| SN |
10 |
60 |
| Nodular shape |
round |
19 |
22 |
0.001 |
| lobulated |
11 |
55 |
| Irregular |
10 |
41 |
| Pleural traction
and depression |
yes |
11 |
87 |
<0.001 |
| no |
29 |
31 |
Table 4: Characteristics of p <0.05 after univariate analysis of quantitative data in clinical and manual imaging characteristics.
| Quantitative characteristics |
Preinvasive lesions |
Invasive lesions |
test of normality p |
Univariate analysis p |
| The longest diameter |
1.27 ± 0.12 |
1.90 ± 0.08 |
0.003 |
<0.001 |
| Non-contrast CT |
value |
-385.33 ± 58.00 |
-149.07 ± 25.81 |
0 |
<0.001 |
| Single |
40 keV |
-270.48 ± 62.27 |
-38.80 ± 27.41 |
0 |
0.001 |
| energy |
70 keV |
-366.61 ± 58.33 |
-127.38 ± 25.80 |
0 |
<0.001 |
| spectrum in |
90 keV |
-398.50 ± 56.76 |
-152.86 ± 25.82 |
0 |
<0.001 |
| arterial stage |
110 keV |
-413.19 ± 56.23 |
-169.25 ± 25.43 |
0 |
<0.001 |
| CT value |
150 keV |
-408.09 ± 57.27 |
-180.16 ± 25.43 |
0 |
<0.001 |
Table 5: Clinical features, manual imaging features, and their coefficients of the included models after the LASSO multivariate regres-
sion analysis.
| Features |
Coefficients |
| Nodular type |
0.612665616 |
active smoking |
1.166783734 |
| Pleural pull and depression |
1.050779324 |
| CT values of 90 keV single energy imaging for enhanced arterial
phase scans /td>
| 0.002036329 |
| CT values of 40 keV single energy imaging for enhanced arterial
phase scans |
-0.000817706 |
| CT values of 150 keV single energy imaging for enhanced arterial
phase scans |
-0.000127868 |
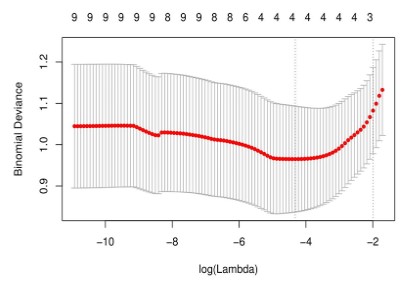
LASSO multivariate analysis of clinical features and manual
imaging features in univariate analysis, as shown in Figure 3; 6
features closely related to the degree of early lung adenocarcinoma infiltration, including nodule type, active smoking, pleural
pull and depression, and arterial single energy (40 / 90 / 150keV)
CT values, as shown in Table 5.
Six clinical features and manual imaging features obtained by
LASSO multivariate regression analysis were constructed as mixed
clinical manual imaging models in the training set and then independently verified with the validation set.
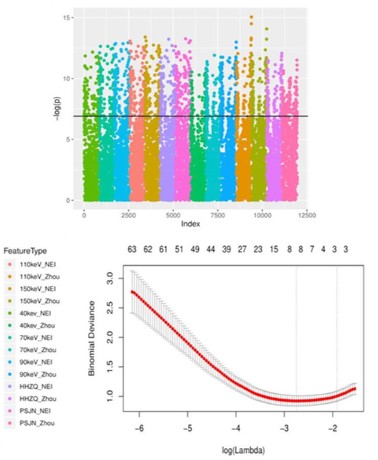
Results of imaging omics analysis
The imaging omics features within ROI 1 and ROI 2 were extracted. The 63-dimensional features were obtained by predimension reduction (p<0.001) after univariate analysis. The LASSO
multivariate regression analysis screened out the 10-dimensional
features (p<0.05) highly related to the degree of lung adenocarcinoma invasion, and the imaging omics model was established, as
shown in Figure 4 and Table 6.
Note: Figure A shows the results after univariate analysis of
imaging omics characteristics and is shown in Manhattan diagram. A total of 63 features retain p <0.001 (above the black line
in Fig). Figure B shows LASSO dimensionality reduction for 63 features with a total of 10 features with p <0.05.
Table 6: Imagiomics features of the included model after LASSO multivariate regression analysis.
| Radiomics characteristics |
Radiomic s group |
Filter |
coefficient |
image sequence |
ROI |
| Skewness |
first order |
wavelet. HLL |
0.256198904 |
Non-contrast |
2 |
| Minimum |
first order |
wavelet.LHH |
-0.006732907 |
Non-contrast |
1 |
| Gray Level Non Uniformity Normalized |
glszm |
wavelet. LLL |
-0.291804896 |
Non-contrast |
1 |
| Maximum |
first order |
wavelet. LHL |
0.010350669 |
Mixedenergy |
1 |
| Maximum |
first order |
wavelet. LHL |
0.06352846 |
90keV |
1 |
| Size Zone Non Uniformity Normalized |
glszm |
wavelet. HLH |
-0.195647523 |
90keV |
1 |
| Low Gray Level Zone Emphasis |
glszm |
wavelet. LHH |
-0.28452662 |
70keV |
2 |
| Small Area Low Gray Level Emphasis |
glszm |
wavelet. LLL |
-0.063355079 |
90keV |
2 |
| Small Area Low Gray Level Emphasis |
glszm |
wavelet. LLL |
-0.27553465 |
110keV |
2 |
| Large Dependence Low Gray Level Emphasis |
gldm |
wavelet. LHH |
-0.099725852 |
70keV |
2 |
Establishment of the hybrid model
The imaging omics features after LASSSO dimension reduction were merged into the imaging omics scores, and then the
statistically significant manual imaging features, clinical features
and imaging omics scores were jointly constructed after multivariate analysis. In the process of establishing the mixed model, the
quantitative characteristics such as the maximum diameter and
CT value of all lesions were eliminated, so as to avoid duplication with the imaging omics characteristics and cause repeated
measurements. In the mixed model, only the imaging-omics score
(p=0.005) was an independent predictor of the degree of early
lung adenocarcinoma infiltration.
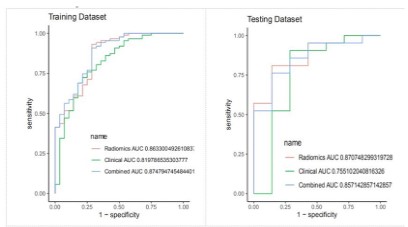
Comparison of the three models and the construction of the
normograph
To compare the diagnostic efficacy of imaging omics models,
hybrid clinical manual imaging models and hybrid models, the
imaging omics model had the highest diagnostic efficacy, followed
by the mixed model, and finally, the mixed clinical manual imaging model. The ROC of the three models is shown in Figure 5. There
was a statistical difference between the imaging omics and hy-
brid, and hybrid clinical manual imaging models, but there was no
statistical difference between the imaging omics and hybrid mo-
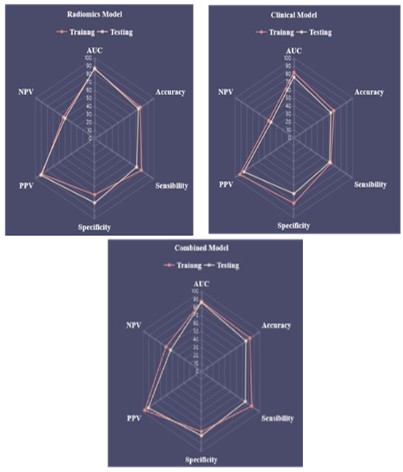
dels, and the six-dimensional capability map of the three models
is shown in Figure 6.
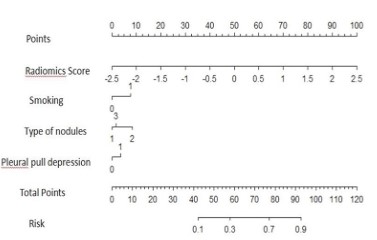
Although the AUC value of the imaging omics model was slightly higher than that of the AUC value of the mixed model, there
was no statistical difference in the diagnostic efficacy (DE LONG
test p=0.84), and the accuracy, specificity and sensitivity of the
mixed model were higher than that of the imaging model, so the
mixed model was converted into norogram for clinical application,
as shown in Figure 7.
Discussion
The diagnostic value of CT on the extent of early lung adenocarcinoma
Some studies in the [2] affirmed the diagnostic value of MSCT
and HRCT to determine the degree of pulmonary nodule infiltration, but it should be further verified by large sample size studies.
With the advent of ESCT, some studies have shown that the detail
display ability and diagnostic accuracy of ESCT for some pulmonary nodules are better than that of conventional CT [3]. Some
studies [4,5] also show that the energy spectrum characteristics
of pulmonary nodules combined with their morphological characteristics and some quantitative characteristics are conducive
to the accurate diagnosis of pulmonary nodules infiltration degree.
The results of this study showed that the maximum diameter
of the lesion, the plain scan CT value, and the single-energy imaging CT value in the enhanced scanning arterial period were all
statistically significant. The mean size of the lesions in this group
was 0.79 cm, 1.9 cm in the invasive group and 1.3 cm in the non-invasive group. The results of this study showed that the maximum
lesion diameter was an independent risk factor for infiltration in
early lung adenocarcinoma, which is consistent with previous literature findings in [6]. Some literature [7] suggested that lesion
CT value was positively correlated with infiltration. In this study,
the lesion CT values on single-energy imaging in the enhanced
scanning arterial phase were statistically different between the
two groups, which is consistent with previous studies on [8]. The
study by Zhang et al. [9] showed that lesion CT values at higher
energy levels (especially 140 keV) were an independent predictor
of the degree of PGGN infiltration, with higher diagnostic accuracy in combination with lesion size. The results of this study show
that the lesion enhanced CT value on single energy imaging is
correlated with the degree of lesion infiltration, but multiple (40
/ 90 / 150keV) levels are statistically significant, the reason is that
the nodules included in this study, the best single energy levels of
different types of nodules, leading to multiple lesions CT values
on single energy imaging are statistically significant results. Due
to the many types of nodules included in this study, the nodule
size threshold and CT threshold were not analyzed in detail.
The nodule type, morphology and pleural traction depression
in this study. Studies in [10] have pointed out that irregular shape
or lobation is closely associated with the rapid appreciation of
tumor cells, and that nodules with irregular shape or lobation
usually predict a higher pathological grade. Another study [11] showed that the nodule circularity predicted the longer-to-short
diameter ratio and the leaf segmentation depth of PGGN infiltration more accurately. At present, most people believe that the
pleural traction depression is mainly caused by the contraction
of the fiber components in the lesion, and it is related to the
location of the lesion (the lesion located in the subpleural area
is more likely to appear in the pleural traction depression). The
study by Chen et al [12] suggested that increased fibroblasts may
be an early event in lung adenocarcinoma infiltration. In recent
years, there is also a view that pleural pull depression may also
be related to the infiltration of surrounding interstitial structures
(lymphatic vessels, lobular space, pulmonary vessels, etc.), and
some studies [13] shows that it is closely related to the degree
of lung adenocarcinoma infiltration. However, the results of this
study showed that the pleural pull depression was correlated
with the degree of focal invasion, which was also consistent with
the [14] results of some studies. The remaining qualitative features were not statistically different between the two groups.
Among them, the lesion location, whether multiple nodules
occurred, and air bronchial signs had no correlation with lung
adenocarcinoma infiltration, which was consistent with most research findings of [15,16]. However, burr features, vacuoles, tumor-lung interface are clear, and vascular tract features are quite
controversial. Some studies [17] showed that whether the burr
sign and the tumor-lung interface are clear is correlated with the
degree of lung adenocarcinoma infiltration, which is inconsistent
with the results of this study. The reason is that the length of
burr was not subdivided in this study. Long burr is usually considered to be correlated with inflammation, while short burr are
mostly manifestations of focal infiltration. The vacuolar sign was
not statistically different in this study, considering the influence
of the included nodules type (the vacuolar sign mostly appeared
in GGN, and the solid nodules were also included in the study
may cause outcome bias). The literature reports that the vascular
tract sign of [18] is an independent risk factor for invasive lung
adenocarcinoma, Most of the previous studies have targeted a
single type of nodules, However, the three types of nodules were
included in this study, It may cause inconsistent research results;
next, The vascular tract collection features included in this study
included the traveling blood vessels in the GGN and the rectified
or disrupted blood vessels in other types of nodules, The traveling blood vessels in GGN include blood vessels with obvious morphological changes, such as stenosis and distortion, and blood
vessels with no obvious morphological changes, Crossing blood
vessels without significant morphological changes may be normal pulmonary blood vessels, This study did not further distinguish between the morphological characteristics of the traveling
blood vessels in the GGN, leading to possible errors in the results.
In the process of model construction, the maximum diameter
and flat scan CT values were eliminated in multivariate analysis,
considering the complex nodule types included in this study, and
the maximum diameter and flat scan CT values of different types
of nodules. In addition, the CT levels were low, medium and high,
which were considered to be affected, but also suggested that
energy spectrum CT can indeed provide richer and useful information. The mixed clinical manual imaging model of this study
had the AUC values of the training set and the validation set
of 0.82, and the accuracy of 0.68 and 0.63, respectively, which
showed some diagnostic efficacy on the degree of infiltration of early lung adenocarcinoma. Xu et al. [19] also established three
models to predict the degree of lung adenocarcinoma infiltration,
respectively, the traditional feature model, imaging omics model
and mixed model, AUC values of 0.824,0.833,0.848, the diagnostic efficacy of the traditional feature model is similar to the mixed
clinical manual imaging model of this study, and the other two
models are higher than the study model.
The diagnostic value of imaging model based on energy spectrum CT for the extent of early lung adenocarcinoma
In this study, 10 selected imaging omics features include the
wavelet algorithm after filtering part of the first order features
and texture features, specific analysis is as follows: (1) FIRSTORDER four imaging omics features: the skewness from different
image sequence, maximum and minimum features filtered by the
wavelet algorithm, these features are closely related to the uniformity of ROI. (2) Five imaging omics features from GLSZM and
one imaging omics feature from GLDM: gray scale, size uniformity
and low gray scale features from different image sequences filtered by wavelet algorithm. The inhomogeneity of gray scale and
the non-uniformity of size area indicate that the volume variability of gray scale level and size area is closely related to the heterogeneity of ROI heterogeneity. The above features indicate that
the uniformity and heterogeneity of IAC lesions are quite different
from the pre-invasive lesions.
This study found that the 10 characteristics from the nodule
itself and the proportion of the characteristics of the peritumoral microenvironment were consistent, suggesting that the peritumoral microenvironment also contains a lot of information
related to the lesions. The peritumoral microenvironment characteristics obtained in this study mainly include deviation and
gray characteristics, reflects the heterogeneity and uniformity of
peritumoral microenvironment, which is closely related to the
density of tumor infiltration lymphocytes in the tumor microenvironment, and the characteristics of [20] and lung adenocarcinoma
infiltration degree [21], but the tumor microenvironment related
research, is still in its infancy, more studies are needed to further
confirm. In addition, this study also found that six of the 10 features came from single-energy imaging (including 70 keV, 90 keV,
110 keV). Although this level was not completely consistent with
the statistically different manual feature level, it also verified the
importance of energy spectrum CT for early lung adenocarcinoma
infiltration degree discrimination, and the incomplete consistency
of imaging features and manual imaging feature results resulted
from manual measurement, so this information needs to be further mined and verified.
The imaging omics model of this study, combined with the
imaging omics features of the lesion itself and in the peritumoral microenvironment, showed high AUC values (0.88,0.87) and
accuracy (0.83,0.76) in the training set and validation set. Wu et
al. [22] also studied the infiltration degree of lung adenocarcinoma, they also extracted the imaging omics characteristics of the
nodules themselves and the peritumoral microenvironment and
established a prediction model. The AUC value (training set AUC
0.89; the validation set AUC 0.87) was similar to the AUC value of
this model, but the study object was pure ground glass nodules,
highly targeted and higher diagnostic efficacy, which confirmed
that CT can provide more useful information than conventional CT. Yang et al. [23] study also included three types of lung nodules,
but this study only extracted the imaging omics characteristics of
lung nodules themselves and established the imaging omics model. The training set AUC value was 0.83; the validation set AUC
value was 0.77, and the diagnostic efficacy was worse than that of
the study model, which shows that the imaging omics characteristics in the peritumoral microenvironment do help to improve the
ability of the imaging omics model to predict the degree of early
lung adenocarcinoma infiltration.
Clinical features, CT morphological features and imaging omics
score were combined. The AUC values in the training set were
0.87 and 0.86, respectively; the accuracy was 0.83 and 0.76, respectively. The results of this study showed that only the imaging
omics score in the mixed model was an independent predictor
of the infiltration extent of early lung adenocarcinoma. Xue et al.
[24] determined the degree of infiltration of 599 PGGN by combining morphological characteristics and imaging omics characteristics. The AUC values of training and validation groups were 0.76
and 0.79 respectively. In addition, the diagnostic efficacy of the
imaging omics model and mixed model (AUC value established
by Xu et al. [25] was 0.833 and 0.848 respectively) was not good
to the imaging omics model and mixed model in this study. The
reason is that this study used DECT scan and extracted the imaging features within the peritumoral microenvironment, dug out
more information helpful to identify the infiltration degree of lung
adenocarcinoma invasion, and improved the diagnostic efficacy
of the study model. She et al. [26] distinguished the pre-invasive
(AAH / A I S/MIA) and invasive (IAC) lesions from 402 nodules and
established a diagnostic model. The AUC value (0.96 and 0.90,
respectively) was higher than the mixed model of this study because of the small sample size of this study, especially the large
sample size difference between the pre-invasive lesions and invasive lesions, which ultimately led to the weak diagnostic efficacy
of the study model.
The results of this study showed that the AUC value and diagnostic accuracy of imaging omics model and mixed model were
higher than those of mixed clinical manual imaging model, and
the difference was statistically significant. Some and only the imaging omics score were the independent predictors of the invasion
degree of early lung adenocarcinoma in the model. The observation and measurement of manual imaging features were limited
to the naked eye and related to the observer experience, with
large error. However, the extraction of the imaging omics features
is more unified and comprehensive, the lesion analysis is more
sufficient, and the judgment of the lesion infiltration is more accurate. However, the processing of imaging omics data is more
complex and requires professional software, so it is still not widely
used in clinical practice.
This study has the following limitations: First, the sample size
of this study is only 196 cases, and the research content is more,
which affects the sensitivity and specificity of the model to some
extent. Second, three types of pulmonary nodules were included
in this study and were not analyzed for a single type of pulmonary nodules, which may bias the analysis of some manual imaging features. Third, this study was a single-center, single-image
source, and did not include CT images of the chest energy spectrum except for FORCE CT, so the model applicability was limited.
References
- Sung H, Ferlay J, Siegel R L, Laversanne M, Soerjomataram I et al.
Global Cancer Statistics 2020: GLOBOCAN Estimates of Incidence
and Mortality Worldwide for 36 Cancers in 185 Countries. CA Cancer J Clin. 2021; 71: 209-249.
- Li FH. Analysis of 64 slice spiral CT dynamic enhanced scanning
characteristics of solitary pulmonary nodules in patients with lung
cancer of different pathological types. Journal of Taishan Medical
College. 2020; 41: 913-915.
- Li Q, Tan H, Lv F. Molecular characterization of solitary pulmonary
nodules in dual-energy CT nonlinear image fusion technology. J
Recept Signal Transduct Res. 2020: 1-5.
- Meng PW, Wang HL, Liu L, et al. Study on the value of force CT
energy spectrum purification technology in the evaluation of pulmonary ground glass nodules. Journal of Medical Imaging. 2020;
30: 960-964.
- Wang YL, Xiang SH, Li N, et al. Value of quantitative parameters of
energy spectrum CT in qualitative diagnosis of pulmonary ground
glass nodules. Tumor. 2020; 40: 488-495.
- Zhou QJ, Zheng ZC, Zhu YQ, et al. Tumor invasiveness defined by
IASLC/ATS/ERS classification of ground-glass nodules can be predicted by quantitative CT parameters. J Thorac Dis. 2017; 9: 1190-
1200.
- Tan XM. Value of dual source CT dual energy imaging in differential
diagnosis of preinvasive lesions \ microinvasive adenocarcinoma
and invasive adenocarcinoma presenting as pulmonary nodules,
Guangxi Medical University, 2019.
- Yang Y, Li K, Sun D, Yu J, Cai1 Z, et al. Invasive Pulmonary Adenocarcinomas Versus Preinvasive Lesions Appearing as Pure Ground-Glass Nodules: Differentiation Using Enhanced Dual-Source Dual-Energy CT. AJR Am J Roentgenol. 2019; 213: W114-W122.
- Zhang Y, Tang J, Xu J, Cheng J, Wu H et al. Analysis of pulmonary
pure ground-glass nodule in enhanced dual energy CT imaging for
predicting invasive adenocarcinoma: comparing with conventional thin-section CT imaging. J Thorac Dis, 2017; 9: 4967-4978.
- Ding H, Shi J, Zhou X, Xie D, Song X, et al. Value of CT Characteristics in Predicting Invasiveness of Adenocarcinoma Presented as
Pulmonary Ground-Glass Nodules. Thorac Cardiovasc Surg. 2017;
65: 136-141.
- Ba W J, Xu D, Yin K. HRCT signs evaluate the infiltration of pure
ground glass nodules: the roundness of pulmonary nodules is better than the long short diameter ratio and the lobulation depth.
Radiology practice. 2020; 35: 1542-1546.
- Chen C, Li WJ, Weng JJ, Chen Z-J, Wen Y-Y, et al. Cancer-associated
fibroblasts, matrix metalloproteinase-9 and lymphatic vessel density are associated with progression from adenocarcinoma in situ
to invasive adenocarcinoma of the lung. Oncol Lett. 2020; 20:
130.
- Fang Rui. Analysis of factors related to pleural depression sign and
visceral pleural invasion of pure ground glass density nodules within 10mm from the pleura in lung adenocarcinoma PLA Medical
College, 2019.
- Qiu ZX, Li WM. Analysis of clinical, pathological and imaging features of 328 cases of lung cancer with solitary ground glass nodules on HRCT. Chinese Journal of respiratory and critical care.
2018; 17: 470-476.
- Jin X, Zhao S H, Gao J, et al. CT characteristics and pathological implications of early stage (T1N0M0) lung adenocarcinoma wit pure
ground-glass opacity. Eur Radiol. 2015; 25: 2532-2540.
- Silva M, Bankier AA, Centra F, Colombi D, Ampollini L, et al. Longitudinal evolution of incidentally detected solitary pure ground-glass nodules on CT: relation to clinical metrics. Diagn Interv Radiol. 2015; 21: 385-390.
- Xing Y, Li Z, Jiang S, Xiang W, Sun X, et al. Analysis of pre-invasive
lung adenocarcinoma lesions on thin-section computerized tomography. Clin Respir J. 2015; 9: 289-296.
- Lu J, Tang H, Yang X, Liu L, Pang M, et al. Diagnostic value and imaging features of multi-detector CT in lung adenocarcinoma with
ground glass nodule patients. Oncol Lett. 2020; 20: 693-698.
- Xu F, Zhu W, Shen Y, Wang J, Xu R, et al. Radiomic-Based Quantitative CT Analysis of Pure Ground-Glass Nodules to Predict the Invasiveness of Lung Adenocarcinoma. Front Oncol. 2020; 10: 872.
- Koh YW, Jeon YK, Yoon DH, Suh C, Huh J, et al. Programmed death
1 expression in the peritumoral microenvironment is associated
with a poorer prognosis in classical Hodgkin lymphoma. Tumour
Biol. 2016; 37: 7507-7514.
- Beig N, Khorrami M, Alilou M, Prasanna P, Braman N, et al. Perinodular and Intranodular Radiomic Features on Lung CT Images
Distinguish Adenocarcinomas from Granulomas. Radiology. 2019;
290: 783-792.
- Wu L, Gao C, Xiang P, Zheng S, Pang P, et al. CT-Imaging Based
Analysis of Invasive Lung Adenocarcinoma Presenting as Ground
Glass Nodules Using Peri- and Intra-nodular Radiomic Features.
Front Oncol. 2020;10: 838.
- Yang B, Guo L, Lu G, Shan W, Duan L, et al. Radiomic signature: a
non-invasive biomarker for discriminating invasive and non-invasive cases of lung adenocarcinoma. Cancer Manag Res. 2019; 11:
7825-7834.
- Xue X, Yang Y, Huang Q, Cui F, Lian Y, et al. Use of a Radiomics Model to Predict Tumor Invasiveness of Pulmonary Adenocarcinomas
Appearing as Pulmonary Ground-Glass Nodules. Biomed Res Int.
2018; 2018: 6803971.
- Xu F, Zhu W, Shen Y, Wang J, Xu R, et al. Radiomic-Based Quantitative CT Analysis of Pure Ground-Glass Nodules to Predict the Invasiveness of Lung Adenocarcinoma. Front Oncol. 2020; 10: 872.
- She Y, Zhang L, Zhu H, Dai C, Xie D, et al. The predictive value of
CT-based radiomics in differentiating indolent from invasive lung
adenocarcinoma in patients with pulmonary nodules. Eur Radiol.
2018; 28: 5121-5128.