Introduction
Liver cancer is a malignant and aggressive tumor which has different histological characteristics and a poor prognosis. As one of
the few tumors with a steady increase in morbidity and mortality,
liver cancer is the second leading cause of cancer-related deaths
in humans in developing countries and the sixth leading cause in
developed countries [1,2]. For patients with early-stage liver cancer, surgery, locally destructive treatment, and liver transplantation offer therapeutic potential. The improved of morphological
heterogeneity of liver cancer has also promoted the development
of targeted therapy [22]. However, these still cannot solve all problems. The treatment of liver cancer is still a serious social and
medical problem. Therefore, identifying specific markers for evaluating liver cancer progression has important clinical significance.
Abnormal glucose metabolism is the key to the occurrence
and development of cancer cells. Aerobic glycolysis is the main
method of cancer cell metabolism [4,5]. Pyruvate kinase (PK) catalyzes the last physiologically irreversible step in glycolysis, the
conversion of phosphoenolpyruvate (PEP) to pyruvate by transferring PEP to ADP [6]. In mammals, PK has four protein kinase
subtypes encoded by two genes. PKLR gene encodes PKL or PKR
subtype [4,7,8]. PKM1 and PKM2 are derived from PKM gene by
mutually exclusive splicing of exon 9 and exon 10, respectively.
By preserving exon 10, PKM2 has important unique properties
in cell metabolic reprogramming and is regulated by complex allosterization, which has become the main competition between
proliferative cells and cancer cells [4,9]. In most cancer cells, the
expression of PKM2 is increased, suggesting that PKM2 may be
an attractive target for cancer therapy [7]. It is worth noting that
studies have confirmed that the expression level of PKM2 varies
in different types of cancer[10]. However, whether PKM2 is highly
expressed in liver cancer and whether it can become a specific
marker of liver cancer remains to be further studied.
In this study, we evaluated the expression of PKM2 in liver cancer, analyzed the relationship between PKM2 expression and clinical features, and discussed the potential prognostic significance
of PKM2 in patients with liver cancer.
Methods
Data mining and collection
We downloaded the clinical data and RNA-seq expression
values of with liver cancer patients from TCGA database in
R(version3.5.1) [11,12]. The RNA-seq by expectation-maximization expression values were used in the statistical analysis.
Statistical analysis
The data were analyzed by R software (version 3.6.1). The box-plots generated by ggplot2 package in R software (version 3.6.1)
was used to describe the difference of mRNA expression among
discrete variable groups. χ-2 and Fisher’s exact tests were used
to analyze the relationship between clinical features and PKM2
expression. The receiver-operating characteristic curve (ROC) was
drawn by pROC software package to evaluate the diagnostic ability. According to the optimal cutoff value of vital status determined by the ROC, the patients were divided into two groups: high
PKM2 expression group and low PKM2 expression group [13]. The
differences of overall survival rate and relapse-free survival rate
between low expression group and high expression group were
compared by Kaplan-Meier curve, and the P value was calculated by log-rank test [14,15]. Univariate Cox analysis was used to
screen related variables, and multivariate Cox analysis was used
to evaluate the effect of PKM2 expression on overall survival and
relapse-free survival. P < 0.05 was statistically significant.
Results
The characteristics of the patient
The gene expression and clinical data of patients with liver
cancer were downloaded from the tumor genome map database,
with a total of 373 people. Detailed clinical features such as disease classification, TNM stage, residual tumor, survival status,
etc., are shown in Table 1.
Table 1: Correlation between the clinicopathologic variables and PKM2 Mrna expression in liver cancer.
| Clinical Characteristic |
Variable |
N |
(%) |
PKM2 mRNA expression |
| high |
n (%) |
low |
n (%) |
χ2 |
P |
| age |
<55 |
117 |
31.37 |
41 |
35.34 |
76 |
29.69 |
0.9 372 |
0.33 3 |
| >=55 |
255 |
68.36 |
75 |
64.66 |
180 |
70.31 |
|
|
| gender |
Female |
121 |
32.44 |
49 |
42.24 |
72 |
28.02 |
6.7 454 |
0.00 94 |
| Male |
252 |
67.56 |
67 |
57.76 |
185 |
71.98 |
|
|
| histological _type |
Fibrolamellar Carcinoma |
3 |
0.8 |
2 |
1.72 |
1 |
0.39 |
11 |
0.00 27 |
| 822 |
| 9 |
|
Hepatocellular Carcinoma
(Mixed) |
363 |
97.32 |
108 |
93.1 |
255 |
99.22 |
|
|
|
Hepatocho langiocarcinoma
(Mixed) |
7 |
1.88 |
6 |
5.17 |
1 |
0.39 |
|
|
| Histologic_g rade |
G1 |
55 |
14.75 |
10 |
8.7 |
45 |
17.79 |
12 |
0.00 58 |
| 504 |
| 5 |
| G2 |
178 |
47.72 |
49 |
42.61 |
129 |
50.99 |
|
|
| G3 |
123 |
32.98 |
52 |
45.22 |
71 |
28.06 |
|
|
| G4 |
12 |
3.22 |
4 |
3.48 |
8 |
3.16 |
|
|
| stage |
I |
172 |
46.11 |
32 |
30.19 |
140 |
57.61 |
26 |
<0.0 001 |
| 858 |
| 6 |
| II |
87 |
23.32 |
30 |
28.3 |
57 |
23.46 |
|
|
| III |
85 |
22.79 |
41 |
38.68 |
44 |
18.11 |
|
|
| IV |
5 |
1.34 |
3 |
2.83 |
2 |
0.82 |
|
|
| T_classification |
T1 |
182 |
48.79 |
36 |
31.03 |
146 |
57.25 |
26 |
<0.0 001 |
| 903 |
| 1 |
| T2 |
95 |
25.47 |
35 |
30.17 |
60 |
23.53 |
|
|
| T3 |
80 |
21.45 |
37 |
31.9 |
43 |
16.86 |
|
|
| T4 |
13 |
3.49 |
8 |
6.9 |
5 |
1.96 |
|
|
| TX |
1 |
0.27 |
0 |
0 |
1 |
0.39 |
|
|
| N_classification |
N0 |
253 |
67.83 |
77 |
66.96 |
176 |
68.48 |
3.6 797 |
0.19 02 |
| N1 |
4 |
1.07 |
3 |
2.61 |
1 |
0.39 |
|
|
| NX |
115 |
30.83 |
35 |
30.43 |
80 |
31.13 |
|
|
| M_classification |
M0 |
267 |
71.58 |
84 |
72.41 |
183 |
71.21 |
0.8 187 |
0.66 53 |
| M1 |
4 |
1.072 |
2 |
1.72 |
2 |
0.78 |
|
|
| MX |
102 |
27.35 |
30 |
25.86 |
72 |
28.02 |
|
|
| radiation_therapy |
NO |
340 |
91.15 |
105 |
96.33 |
235 |
98.33 |
0.5 879 |
0.44 32 |
| YES |
8 |
2.14 |
4 |
3.67 |
4 |
1.67 |
|
|
| residual_tumor |
R0 |
326 |
87.4 |
93 |
81.58 |
233 |
92.46 |
11 |
0.00 7 |
| 512 |
| 7 |
| R1 |
17 |
4.56 |
8 |
7.02 |
9 |
3.57 |
|
|
| R2 |
1 |
0.27 |
0 |
0 |
1 |
0.4 |
|
|
| RX |
22 |
5.9 |
13 |
11.4 |
9 |
3.57 |
|
|
| vital_status |
DECEASE D |
130 |
34.85 |
56 |
48.28 |
74 |
28.79 |
12 |
0.00 04 |
| 516 |
| 2 |
| LIVING |
243 |
65.15 |
60 |
51.72 |
183 |
71.21 |
|
|
High expression of PKM2 in liver cancer
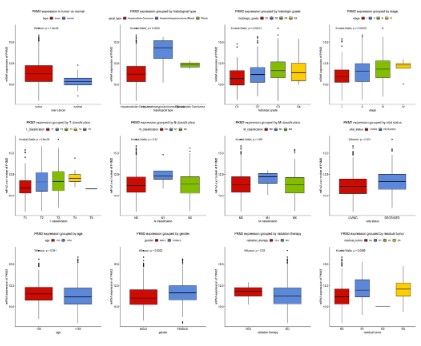
We measured the difference in the expression of PKM2 mRNA
between patients with liver cancer patients and normal controls,
and expressed this result with boxplots. As shown in figure 1, the
expression of PKM2 in patients with liver cancer patients is significantly higher than that in normal subjects (P=1.8e-08). There
were also differences in PKM2 expression among different histological types (P=0.0025), histological grade (P=0.00013), stage (P
<0.0035), T classification (P=9.6e-05), vital status (P=0.001), age
(P=0.041), gender (P=0.0022) and residual tumor (P<0.0066). The
expression of PKM2 increased gradually with the progress of disease stage and T classification. However, there was no significant
correlation between the expression of PKM2 and N classification
(P=0.32), M classification (P=0.65), and whether received radiotherapy (P=0.33).
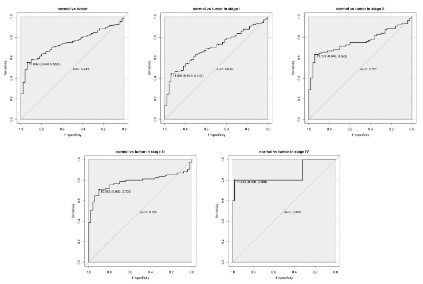
Diagnostic capability of PKM2
As shown in the ROC in figure 2, and the area under the curve
(AUC) is 0.745, indicating that PKM2 has moderate diagnostic
ability. Subsequently, similar results were shown in the subgroup
analysis of different stages. (AUC: 0.699 for stage I, 0.757 for stage
II, 0.786 for stage III, 0.860 for stage IV).
Relationship between expression of PKM2 and clinical features
We analyzed the relationship between the expression of PKM2
and the clinical features of liver cancer. As shown in Table 1, we
found that the high expression of PKM2 was closely related to
gender (P=0.0094), histological type (P=0.0027), histological
grade (P=0.0058), stages (P<0.01), T classification (P<0.01), residual tumor (P=0.007), vital status (P=0.0004) and overall survival
(P=0.0003).
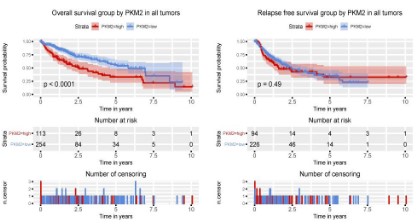
PKM2 expression is correlated with poor prognosis in liver
cancer patients
To evaluate the effect of PKM2 expression on the prognosis of
patients with liver cancer, we used Kaplan-Meier survival curve
combined with log-rank test to evaluate the relationship between
PKM2 expression and overall survival and relapse freesurvival. As
shown in figure 3, there was a significant difference in overall survival between patients with PKM2 high expression and patients
with low PKM2 expression (P<0.0001). Patients with high expression of PKM2 had poorer overall survival, but there was no significant difference in relapse-free survival (P=0.49).
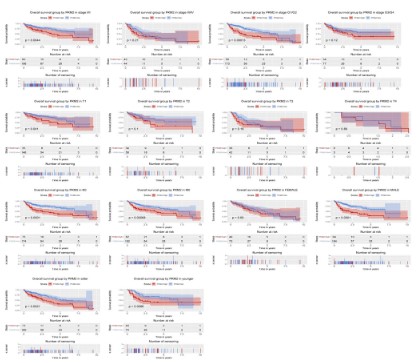
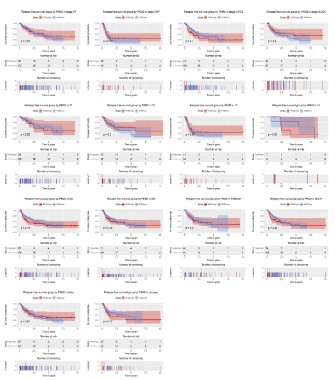
Subgroup analysis of the prognostic value of PKM2 expression in term of overall survival
To further explore the prognostic value of PKM2 in term of
overall survival, we conducted a subgroup analysis. The results
showed that patients with high PKM2 expression had poor overall
survival in subgroup of stage I/II (P=0.0044) and histological G1/
G2 (P=0.00013), T1 (P=0.041), N1 (P=0.00068), male (P<0.0001),
elder (P=0.0021) and young (P=0.0086).
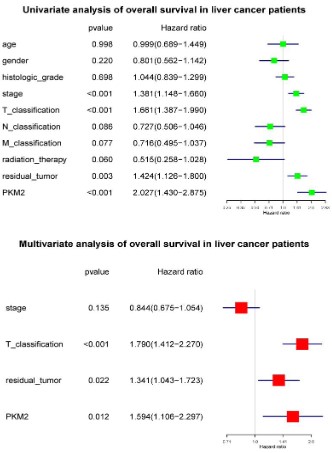
High PKM2 is an independent risk factor of liver cancer patients’ overall survival
To select the potential variables associated with overall survival, we conducted a univariate analysis of key variables including PKM2 expression, clinical stage, TNM classification, residual
tumors, etc. Multivariate analysis with the cox proportional hazard model showed that T classification (HR=1.790, 95%CI: 1.412-
2.270, P<0.001), residual tumor (HR=1.341, 95%CI: 1.043-1.723,
P<0.022) and PKM2 expression (HR=1.594, 95%CI: 1.106-2.297,
P<0.012) were independent risk factors affecting the overall survival of liver cancer patients (Figure 5).
Subgroup analysis of the prognostic value of PKM2 expression in term of relapse free survival
Although the high expression of PKM2 had no significant effect
on the relapse-free survival of liver cancer patients, we conducted a subgroup analysis to mining its prognostic value in specific
population. The results showed no significant in subgroup such
as stage, histological grade, TNM classification, gender, and age.
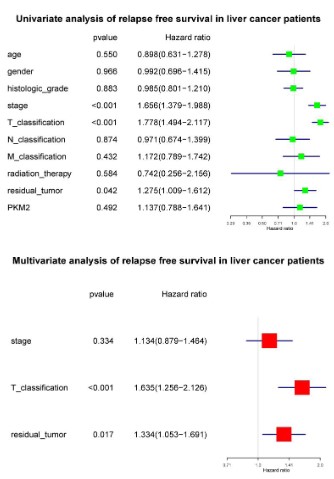
High PKM2 is not an independent risk factor of liver cancer
patients’ relapse free survival
To select the potential variables associated with overall survival, we conducted a univariate analysis of key variables including
PKM2 expression, clinical stage, TNM classification, residual tumors, etc. Further multivariate cox analysis showed that T classification (HR=1.635, 95%CI: 1.256-2.126, P<0.001) and residual tumors (HR=1.334, 95%CI: 1.053-1.691, P=0.017) were independent
factors affecting relapse-free survival (Figure 7).
Discussion
In this study, we confirmed the role of PKM2 in liver cancer.
PKM2 is highly expressed in patients with liver cancer, which is
closely related to gender, histological type, histologic grade, stage,
T classification and residual tumor. At the same time, we proved
the relationship between the high expression of PKM2 and the
prognosis of liver cancer, we consider that PKM2 can be used as a
biomarker to evaluate the prognosis of liver cancer.
Aerobic glycolysis is a common feature of tumor tissue. As
a rate-limiting enzyme that catalyzes the last step of glycolysis,
PKM2 has attracted much attention in tumor research in recent
years. In recent years, a large number of studies have shown that
PKM2 is preferentially expressed in malignant tumors and plays
an important role in cancer cell proliferation and tumor growth
[16]. Inhibiting the activity of PKM2, destroying the stability of
PKM2 structure can reduce the glycolysis activity of PKM2, which
inhibit the development and formation of tumor [17]. The results
of this study show that the expression of PKM2 in patients with
liver cancer is significantly higher than that in the normal group,
which fully illustrates the role of PKM2 in the proliferation of liver cancer cells, which is also consistent with the results of other
tumor studies. In addition, the expression of PKM2 is different in
different histological types of liver cancer, and the expression of
PKM2 is the highest in cholangiocarcinoma, suggesting that it may
be related to the occurrence of liver cancer. At the same time,
with the development of disease stage and T classification, the
expression of PKM2 gradually increased, indicating that PKM2 is
closely related to the progression of liver cancer, and the increase
of PKM2 activity can make cancer cells produce more energy for
utilization. The expression of PKM2 is higher in patients less than
55 years old, which may be related to the regulation of cancer metabolism. Interestingly, the expression of PKM2 is higher in male
patients, and the relationship between its expression and gender
can be further explored.
Studies have shown that PKM2 can be used as a biomarker of
renal and testicular cancer and has a particular diagnostic value
[18-21]. According to the results of ROC curve of PKM2, PKM2
also shows reasonable diagnostic ability for liver cancer, and is
expected to be combined with other markers in the diagnosis of
liver cancer in the future.
PKM2 plays an important role in the prognosis of patients with
liver cancer. According to the results of the study, we found that
patients with high expression of PKM2 had a lower overall survival rate. It is especially obvious in stage I / II and G1 /G2, which provide corresponding help for the targeted therapy of liver cancer
in the future. The high expression of PKM2 has a significant effect
on the overall survival rate of male patients, but not in female
patients. The complex interaction of PKM2 in genitourinary and
endocrine system needs to be further studied. At the same time,
PKM2 is an independent risk factor affecting the prognosis of liver
cancer, which provides evidence for PKM2 to become a biomarker
of liver cancer.
This study confirmed the close relationship between the expression of PKM2 and liver cancer, and explored the important
role of PKM2 in the prognosis. It provides a new idea for the diagnosis and prognosis of liver cancer. However, the role of PKM2
and related mechanism is complex, more in-depth research is
needed in the future.
Conclusion
PKM2 is highly expressed in patients with liver cancer and is
related to a variety of clinical features. High PKM2 expression is an
independent risk factor affecting the prognosis of liver cancer, and
can be used as a biomarker to evaluate the prognosis of patients
with liver cancer.
Acknowledgements: None
Conflicts of interest: All authors have completed the ICMJE
uniform disclosure form. The authors have no conflicts of interest
to declare.
Ethical statement: The authors are accountable for all aspects
of the work in ensuring that questions related to the accuracy or
integrity of any part of the work are appropriately investigated
and resolved.
References
- Li L, Wang H. Heterogeneity of liver cancer and personalized therapy. Cancer Lett. 2016; 379: 191-197.
- Liu CY, Chen KF, Chen PJ. Treatment of Liver Cancer. Cold Spring
HarbPerspect Med. 2015; 5: a021535.
- Sia D, Villanueva A, Friedman SL, Llovet JM. Liver Cancer Cell of
Origin,Molecular Class, and Effects on Patient Prognosis. Gastroenterology. 2017; 152: 745-761.
- Zhou Y, Liu K, Liu Y, Tan L. MicroRNA-34a inhibit hepatocellular carcinoma progression by repressing hexokinase-1. Journal of cellular
biochemistry. 2018.
- Liu M, Wang Y, Ruan Y, Bai C,Qiu L et al. PKM2 promotes reductive
glutamine metabolism. Cancer Biol Med. 2018;15: 389-399.
- Dayton TL, Jacks T, Vander Heiden MG. PKM2, cancer metabolism,
and the road ahead. EMBO Rep. 2016; 17: 1721-1730.
- Dong G, Mao Q, Xia W, XU Y, WANG J, et al. PKM2 and cancer: The
function of PKM2 beyond glycolysis. Oncol Lett. 2016; 11: 1980-
1986.
- Zhang Z, Deng X, Liu Y, Liu Y, Sun L, Chen F. PKM2, function and
expression and regulation. Cell Biosci. 2019; 9: 52.
- Wong N, Ojo D, Yan J, Tang D. PKM2 contributes to cancer metabolism. Cancer Lett. 2015; 356: 184-191.
- Azoitei N, Becher A, Steinestel K, Rouhi A, Diepold K, et al. PKM2
promotes tumor angiogenesis by regulating HIF-1alpha through
NF-kappaB activation. Mol Cancer. 2016; 15: 3.
- Samur MK. RTCGAToolbox: a new tool for exporting TCGA Firehose
data. PLoS One. 2014; 9: e106397.
- Team RC. R: A language and environment for statistical computing.
MSOR connections. 2014; 1.
- Robin X, Turck N, Hainard A, Tiberti N, Lisacek F, et al. pROC: an
open-source package for R and S+ to analyze and compare ROC
curves. BMC Bioinformatics. 2011; 12: 77.
- Therneau TM. A Package for Survival Analysis in S. 1999.
- Lin H, Zelterman D. Modeling Survival Data: Extending the Cox Model. Technometrics. 2002; 44: 85-86.
- Zhou Z, Li M, Zhang L, Zhao H, Şahin O, et al. Oncogenic Kinase-Induced PKM2 Tyrosine 105 Phosphorylation Converts Nononcoge-
nic PKM2 to a Tumor Promoter and Induces Cancer Stem-like Cells.
Cancer Res. 2018;78: 2248-2261.
- Lv L, Li D, Zhao D, Lin R, Chu Y, et al. Acetylation targets the M2
isoform of pyruvate kinase for degradation through chaperone-mediated autophagy and promotes tumor growth. Mol Cell. 2011;
42: 719-730.
- Weinberger R, Appel B, Stein A, Metz Y, Neheman A, et al. The
pyruvate kinase isoenzyme M2 (Tu M2-PK) as a tumour marker for
renal cell carcinoma. Eur J Cancer Care (Engl). 2007;16: 333-337.
- Wechsel HW, Petri E, Bichler KH, Feil G. Marker for renal cell carcinoma (RCC): the dimeric form of pyruvate kinase type M2 (Tu
M2-PK). Anticancer Research. 1999; 19: 2583-2590.
- Pottek T, Muller M, Blum T, Hartmann M. Tu-M2-PK in the blood of
testicular and cubital veins in men with testicular cancer. Anticancer Research. 2000; 20: 5029-5033.
- Eigenbrodt E, Basenau D, Holthusen S, Mazurek S, Fischer G. Quantification of tumor type M2 pyruvate kinase (Tu M2-PK) in human
carcinomas. Anticancer Research. 1997; 17: 3153-3156.