Introduction
Brain Metastases (BM), also called secondary brain tumors,
are the most common type of intracranial tumors and are caused
by cancer cells spreading via the bloodstream to the brain from
different parts of the body. More than 70% of patients with
brain metastasis present with multiple lesions [1]. The classic
treatment of BM used to be Whole-Brain Irradiation (WBRT), in
which a uniform dose is delivered to the total volume of brain
tissue, thus ensuring total coverage of all brain metastases; this
approach would cause lasting side effects and morbidity. A more
modern approach involves advanced radiotherapy techniques
such as Stereotactic Radiosurgery (SRS), which have been used
widely as an alternative to WBRT. Regardless of the machine
delivery technique, an SRS plan delivers a high dose of radiation
to a target with a sharp dose falloff and low fractionation. By
definition, SRS entails the delivery of one high dose of radiation,
whereas hypofractionated Stereotactic Radiotherapy (SRT)
regimen delivers up to five relatively high doses of radiation to
the target. There are two LINAC-based techniques for treating
multiple targets in the brain - the MIMT and the SIMT techniques.
In the MIMT technique, the isocenter is placed inside each target
and delivers the prescribed dose to the Planning Target Volume
(PTV). This can be problematic when targets are not far enough
from each other. Moreover, DT and the time the patient is on
the treatment table proportionally increase by increasing the
number of targets. Furthermore, controlling the dose to organs-at-risk (OAR) can become challenging when arcs overlap between
multiple isocenter positions. SIMT can be used to cover all targets
by using a single isocenter that is placed at a midpoint, typically
the center of mass of all targets in one plan. A meaningful, patientcentered benefit of using this technique is reducing treatment
time significantly compared to MIMT [2]. Also, the efficiency is
generally improved as patient imaging and couch shifts only need
to be done once, and the total number of beams used will be less
than MIMT plans. Currently, there are no guidelines regarding the
treatment technique, the location of the isocenter, the evaluation
of the plan quality, and the impact of Grid Size (GS) and energy
on plan quality metrics for multi-target treatment. The goal of
this dosimetric study is to compare MIMT and SIMT techniques
by evaluating indices including Paddick conformity (PCI), RTOG_conformity index (RTOG_CI), PGI, DT, and V8, V12 of the brain.
Additionally, assessing the effect of the location of the isocenter,
GS, and energy on dosimetric indices in the SIMT technique may
establish a guideline that can be used in clinics.
Material & methods
Treatment planning
Cranial CT scans of 21 anonymized patients were selected, and
a range of 4 to 12 (mean 8) Gross Tumor Volumes (GTV) was drawn
for each scan. A 2 mm isotropic margin was added to each target
to define the PTV to account for setup error, movement, and any
possible geometric variations [3]. The average volume size of PTV
was 1.87 cm3 (range 0.06-20 cm3). All targets were prescribed to
receive 24 Gy in 3 fractions (SRT). Salari et al [4] studied the effect
of GS and energy on gamma passing rate in the SIMT technique,
reporting that 6MV Flattening Filter-Free (FFF) with a GS of 1mm
results in higher plan quality in terms of gamma passing rate. For
this reason, all treatment plans were designed using 6 MV-FFF with a maximum dose rate of 1400 MU/min and a GS of 1 mm. All
Volumetric Modulated Arc Therapy (VMAT) plans were created in
RayStation® TPS (Ver.10.A) (RaySearch Medical Laboratories AB,
Stockholm, Sweden) using collapsed cone convolution algorithms
(Ver. 5.3) for both techniques. The collimator angle was 30 or 330
[5], gantry angle sampling of 2° between the control points [6],
and 5 non-coplanar partial arcs (couch 0°, ±45°, ±90°) to reduce
the dose to OARs [7] were used for both MIMT and SIMT. All plans
were designed for Varian Edge linac (Varian Medical Systems, Palo
Alto, CA) which is equipped with a Varian High Definition 120
multileaf collimator (MLC), with 2.5 mm leaf width in the inner
section of 8 cm of the field, and 5 mm leaf width in the outer
section of the field. A Boolean operator was used to combine all
individual PTV into a single PTV, which was named “PTVs.”
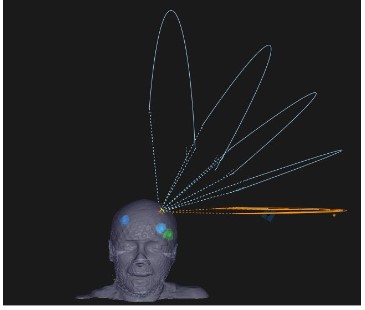
MIMT Planning
SRS plans were made for each target and the isocenter was
set in the center of the target. The gantry angle was based on
minimizing the overlap between arcs for nearby targets as
much as possible (Figure 1). Then composite plans, which sum
up all individual SRS plans, were made for plan evaluation and
comparison. A dose normalization of 100% of the prescribed dose
(Dp) at 95% of PTV was adopted, while < 2% of PTV < 130% Dp was
accepted.
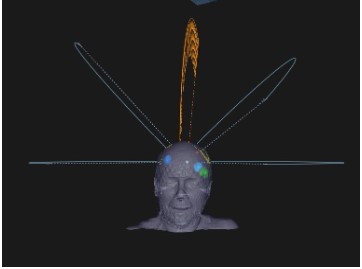
SIMT Planning
In this technique, a single isocenter is located at the midpoint
of all targets to cover all PTVs in one plan (Figure 2). Volumetric
dose prescription was adopted, by normalizing 100% Dp to 95% of
the volume of all PTVs, while D2%(PTV) <130% Dp was accepted.
Nevertheless, we checked the coverage of each individual PTV to
ensure none of them were under or over-treated.
Quality metrics
In-house scripts were written in RayStation Scripting
Application Programming to calculate and extract data directly
from RayStation TPS. The plan quality metrics used in this study
include dosimetric indices such as the RTOG_CI, PCI, PGI, and
dose-volume metrics V8 and V12 as follows:
RTOG_conformity index
Shaw et al [8] proposed the concept of conformity index by
using Equation 1. This concept has been used in radiation therapy
oncology group (RTOG) guidelines.
 (1)
(1)
Where PIV is the volume of the prescription isodose and TV
is the tumor volume. The ideal value of RTOG_CI is 1. This index
provides information regarding the over-coverage and under-coverage of the target. When the target is overtreated, the value
is greater than 1, and if it is undertreated, RTOG_CI is less than
1. However, this ratio does not consider the location of the PIV
relative to the TV.
Paddick conformity index
In 2000, Paddick proposed a conformity index (Equation 2) as
an alternative to RTOG_CI. This index is based on the volume of
the target covered by PIV.
 (2)
(2)
Where  is the volume of the target covered by the prescribed isodose. This index is equal to 1 for a perfectly conformal
plan and does not give any information about whether there is an
over-coverage or under-coverage of the target [9].
is the volume of the target covered by the prescribed isodose. This index is equal to 1 for a perfectly conformal
plan and does not give any information about whether there is an
over-coverage or under-coverage of the target [9].
Conceptually, conformity indices quantify how the isodose
conforms to the shape and size of the target. Both conformity indices were calculated per target in this study.
Paddick gradient index
This index, as defined by Paddick and Lippitz [10], quantifies
the dose fall-off beyond the target volume. This metric is important to consider for SRS techniques. A steep dose gradient outside
the PTV is a hallmark of the SRS technique to reduce the dose
spillage to adjacent OAR. For this assessment gradient indices
have been proposed to compare different treatment plans with
the same conformity. In this study, this index was calculated based
on Equation 3.

(3)
PIV50% refers to the volume of 50% isodose. Generally, PGI ≤ 3
for a single lesion but data are not available for treatment plans
with more than one target. It is expected to observe greater values for plans with more than one lesion compared to a single
target plan. In practice, for multitarget plans, PGI is usually calculated per plan because of dose bridging between adjacent targets
or isodose volumes. Therefore, in this study, PGI was computed
per composite plan for MIMT and per plan for SIMT techniques.
V8 & V12
In 2009, Blonigen et al. found that the volume of normal brain
tissue receiving 8 Gy (V8) through 12 Gy (V12) was “significantly
predictive of both asymptomatic and symptomatic radiation necrosis in LINAC-based, single-fraction SRS of the brain metastases
[11]. Therefore, in this study both V8 and V12 were calculated per
plan.
Delivery time(s)
The total time required to deliver a whole plan from the start
of the first arc to the end of irradiation was considered as delivery time. These data were extracted directly from RayStation TPS
using an in-house script.
Effect of isocenter location in SIMT
Distance to the isocenter was calculated based on the center
of each PTV to the isocenter and was extracted from the TPS directly using an in-house script. PTVs were at varying distances
from the isocenter with an average of 4.6 cm (range 1.45 to 8.75
cm). Then to determine the effect of isocenter location on dosimetric indices, the correlation between isocenter location and
dosimetric indices were analyzed.
Impact of grid size and energy in SIMT
Ten patients with 6 to 10 targets (a total of 92 targets) and
an average size of 1.2 cm3 (range 0.57-2.68 cm3) were randomly
selected. A total of 40 VMAT plans for the Varian Edge Linac using 6 MV and 10 MV Flattening Filter-Free (FFF) beams and GS of 1
mm and 2 mm resulting in four plans per patient were created. All
parameters and objectives except dose grid and energy were kept
the same in all treatment plans. All targets per plan were treated
to the same dose (24 Gy in 3 fractions) and treatment plans were
normalized to 95% of each target receiving 100% of the prescribed dose. Next, dosimetric indices including PCI, RTOG_CI for
each target, and PGI for each plan were calculated.
Statistical analysis
SPSS Ver.27 was used for performing a two-sample independent t-test for RTOG_CI, PCI, PGI, V8, and V12 to determine any
statistically significant difference between MIMT & SIMT. Moreover, the Pearson correlation coefficient (CC) was calculated to find
a correlation between target size and quality metrics for both
techniques. In addition, the correlation between distance to iso-center and dosimetric indices for SIMT were studied. One-Way
ANOVA followed by the Post Hoc Tukey test and a two-sample
independent t-test were also performed for statistical analysis of
the impact of GS and energy on dosimetric indices in SIMT. A P-value of 0.05 was considered significant as the mean difference.
Results
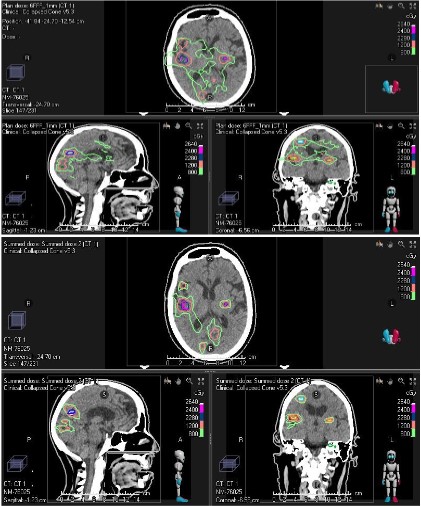
For all 21 patients, clinically acceptable treatment plans were
achieved by both MIMT and SIMT techniques. Figure 3 shows the
dose distribution for both methods for patient #14 who had 10
PTVs.
Both PCI & RTOG_CI were computed per target, and PGI, V12,
and V8 were computed per plan for SIMT and per composite plan
for MIMT. The result of those calculations is shown in Table 1. As
shown here, the RTOG_CI values in MIMT are greater than SIMT
(1.377 ± 0.403 vs. 1.267 ± 0.414, p < 0.05) which indicates all PTV
were over-covered in MIMT. Also, MIMT has smaller PCI in comparison with SIMT (0.74 ± 0.142 vs. 0.78 ± 0.129, p < 0.05) (Table
1).
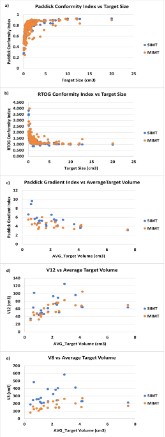
Both RTOG and Paddick indices approached unity as the target volumes increased (Figures 5a & 5b). Despite differences
between targets, it appeared that both conformity indices have
similar trends in both methods. As it is shown in Figure 4c, PGI
tends to be smaller for larger targets in both techniques. Statistical analysis (Table 2) demonstrates very strong and strong correlations between target size and PCI, RTOG_CI, and PGI (0.841,
-0.789, -0.725, p<0.05) respectively in the SIMT. A similar trend
was observed for target size vs PCI and RTOG_CI, (0.675, -0.656,
p<0.05 respectively) but a moderate correlation between target
size and PGI (-0.504, p<0.05) was found in MIMT plans. No correlation was observed between target size and V8 (0.051, p = 0.827)
in SIMT while a strong positive correlation was observed between
target size and V8 (0.708, p<0.05) in MIMT. A moderate correlation (0.522, p<0.05) and very strong correlation (0.802, p<0.05)
for target volume and V12 was observed for SIMT and MIMT, respectively.
The independent sample t-test gave values of 2.577 and -2.463
for PCI and RTOG CI, respectively. These are both beyond the
critical values for a two-tailed t-test. P<0.05 for both conformity
indices highlight a statistically significant difference between the
two methods. The gradient index of SIMT is higher than MIMT
(5.379 ± 1.58 vs. 4.336 ± 0.781, p < 0.05) (Figure 4c). The volumes that receive 12 Gy and 8 Gy are compared in this study. Both V12
and V8 were larger for SIMT compared to MIMT (Figures 4d &
4e). However, the V12 of each plan was comparable between both
techniques (p = 0.247) while a significant difference was observed
for V8 (p<0.05).
Additionally, the Pearson correlation coefficient was performed on SIMT data to find the impact of distance to the isocenter
on dosimetric indices, and no correlation was seen between them
(Table 3).
Delivery times for all 21 patients with a total of 168 BM with an
average of 8 lesions (range 4-12) were analyzed. MIMT plans treated all 168 lesions with 168 isocenters while SIMT plans treated
the same 168 targets with 21 isocenters. The MIMT plans averaged
1264 seconds (21.1 minutes) of beam-on time versus the SIMT
plans which averaged 252 seconds (4.2 minutes), amounting to an
80% reduction in time for treatment delivery; this is a meaningful
difference to the patient, as well as to the radiation therapists.
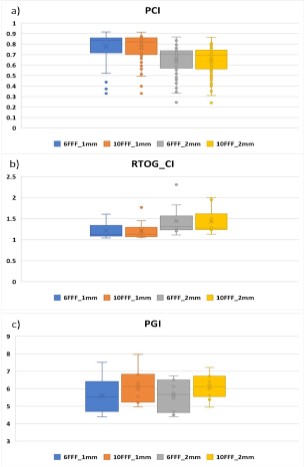
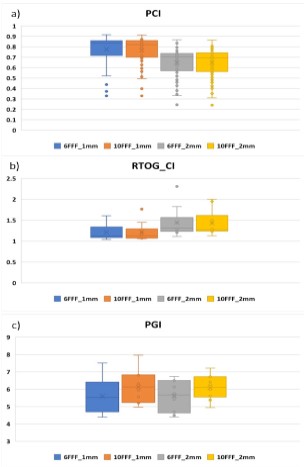
Figure 5 illustrates box plots (Whisker charts) of PCI, RTOG_CI,
and PGI for various energy and GS. Box plot is a graphical rendition of statistical data based on the minimum, first quantile
(Q1), median, third quantile (Q3), and maximum. Outliers can
be indicated as small circles in this plot. In statistics, an outlier
is an observation point that is distant from other observations.
However, they do not necessarily indicate an unacceptable data.
Our analysis demonstrates that for PCI, there was no statistically
significant correlation to energy for a given GS, but a significant
correlation was found with GS, with smaller GS yielding higher PCI
values (p = 0.012). For RTOG_CI, GS was a significant classifier (p =
0.036), but the energy was not. Furthermore, statistically significant differences between different energies were found for PGI (p = 0.024) but PGI did not demonstrate any statistically significant
differences between different GS (p = 0.209).
The effect of varying number of targets on PGI, V8, and V12 is
shown in Figure 6. As it is illustrated these metrics depend on the
number of targets and deteriorate (i.e., dose to normal tissues
increases) as this number increases. According to our data, we
can see that for less than 6 targets, higher plan quality can be
achieved using SIMT in terms of low-dose spillage or bath.
Discussion
Several studies have assessed the SIMT technique for treating
multiple lesions. In 2007 VanderSperk et al [12] used a single iso-center with 8 to 14 noncoplanar fields and concluded that SIMT is
a sensible and well-tolerated treatment for patients with multiple
intracranial tumors. They also noted that MIMT might have some
dosimetric improvement compared to SIMT but is not clinically significant. Clark et al [13] treated three brain lesions with different
techniques including single-arc/single-isocenter, triple-arc (non-coplanar)/single-isocenter, and triple-arc (coplanar)/triple-iso-center configurations, and showed single-isocenter with multiple
noncoplanar arcs can be used to deliver conformity equivalent to
that of MIMT.
This study compares the dosimetric feasibility of performing
MIMT vs SIMT when treating multi-targets in the brain using 5
non-coplanar arcs. One of the main concerns for the SIMT plans
is the increased low dose “bath” to the intervening and adjacent
normal brain tissue/parenchyma outside the targets. This may
be because island blocking happens in SIMT, which yields more
dose spillage to surrounding normal tissue compared to MIMT (Figure 3) [14,15], or a larger jaw opening increasing the leakage of
dose between the leaves [16]. Therefore, a higher low dose (V8)
is expected for SIMT compared to MIMT as we can see in Table
1, Figures 4 and 4e. Wu et al proposed a solution to reduce the
stray low dose to normal brain tissue by optimizing couch and collimator angles [16]. In SIMT, PGI has greater values than MIMT,
and V12 (50% prescription isodose) is comparable between both
techniques. Consequently, the higher value of PGI is not because
they may have larger 50% isodose volumes but because they have
smaller 100% prescription isodose volumes compared to MIMT
(Figure 3). This finding is in line with previous studies [13,17].
Furthermore, our findings revealed that PCI and RTOG_CI
strongly depend on the volume of the tumor which is in agreement with the results of Prentou et al [14]. They also showed
better conformity values are achievable when number of targets
is less than 6, and increasing the number of targets causes poor
conformity [14]. Also, the result in this study indicates low-dose
spillage to normal tissue is greater in SIMT compared to MIMT
for plans with more than 6 targets which is independent of the
isocenter location.
There are several dosimetric uncertainties regarding the location of the isocenter in SIMT because the isocenter is not inside of
any target, and couch rotation error may have a great impact on
dose distribution for tiny targets that are further away from the
isocenter [18]. Amaya et al (2020) [2] showed that couch rotational error can be rectified by using 6 degrees of freedom couch.
Moreover, Aoki et al [19] and Kraft et al [20] studied the effect of
distance to isocenter on survival and local rates of targets in SIMT
and indicated distance to isocenter is not associated with tumor
response. The result of present study also showed that there is
no dependency between all quality metrics and location of the
isocenter relative to PTV in the SIMT technique.
According to our result, the delivery time of SIMT was 80%
shorter than that for MIMT including setup time and image-guidance procedure. The total treatment time can easily be shorter than 10-15 minutes, which makes a difference to the patient.
The main reason is that setup and imaging only need to be done once with the use of one isocenter to treat all targets. This translates into increased efficiency and throughput in the treatment
consoles, and can improve the patient experience and satisfaction, as well as reduce machine utilization. These findings are also
comparable with prior studies [17,21,22].
Table 1: Results of conformity indices, Gradient index, V12, and V8 calculated for both SIMT & SIST treatment plans.
|
PCI |
RTOG_CI |
PGI |
V12 (cc) |
V8 (cc) |
| SIMT |
0.778 ± 0.129 |
1.267 ± 0.414 |
5.379 ± 1.580 |
66.730 ± 22.671 |
293.116 ± 110.135 |
| SIST |
0.740 ± 0.142 |
1.377 ±0.403 |
4.336 ± 0.781 |
59.256 ± 18.371 |
169.451 ± 51.683 |
Table 2: Shows the correlation between target size and quality metrics for both SIMT and SIST techniques.
|
|
|
PCI |
RTOG_CI |
PGI |
V8 |
V12 |
| SIMT |
Target_Volume |
Correlation Coefficient |
0.841 |
0.789 |
0.725 |
0.051 |
0.522 |
| P-Value |
1.21E-72 |
1.05E-53 |
1.00E-05 |
0.827 |
1.00E-04 |
| N |
168 |
168 |
21 |
21 |
21 |
| SIST |
Target_Volume |
Correlation Coefficient |
0.675 |
-0.656 |
-0.504 |
0.708 |
0.802 |
| P-Value |
1.00E-03 |
1.00E-04 |
1.21E-05 |
7.80E-05 |
1.30E-04 |
| N |
168 |
168 |
21 |
21 |
21 |
Table 3: The Spearmen Correlation Coefficient between Distance
to isocenter and quality metrics for SIMT technique. P<0.05 considers a significant difference.
|
|
PCI |
RTOG_CI |
PGI |
V8 |
V12 |
| Distance to
isocenter |
Correlation Coefficient |
-0.122 |
0.116 |
-0.413 |
0.2 |
0.316 |
| P-Value |
0.026 |
0.035 |
0.63 |
0.385 |
0.163 |
| N |
168 |
168 |
21 |
21 |
21 |
Results of the evaluation of impact of energy and GS on PCI
and RTOG_CI indices are shown in Figure 5a& 5b. According to the
Pearson correlation test, no significant difference was observed
between 6MV FFF and 10 MV FFF for both conformity indices.
We believe this is mostly related to the dose-control tuning structures in the inverse optimization process which aims to deliver the
prescribed dose to the targets and spare OAR as much as possible.
This can be achieved regardless of which energy is used [23,24].
On the other hand, using different GS results in a significant difference in conformity indices. We believe this is related to the way
TPS is performing dose calculation. The dose is linearly interpolated between dose points on the calculation grid; therefore, 1 mm
GS has more data point than 2 mm GS which can result in less
uncertainties in dose calculation. This is more dominant factor for
small targets because a small change in the estimated volume can
be a large fraction of the structure volume [25].
The gradient index is a measure of how quickly the out-of-field
dose decreases away from the target edge. An improved dose gradient is indicative of less peripheral dose which leads to better
sparing of the OARs. This is linked to the dosimetric characteristics
of the beam. A beam with a higher quality index will be more penetrating and may contribute to a higher peripheral dose. Figure
5c demonstrates a box plot of the PGI ranges, showing more dose
spillage around the target as the energy increases. This indicated
that the more penetrating beam energy of 10 MV FFF leads to an
increase in dose at a distance compared with the 6MV FFF. Our
finding related to energy is in line with Laoui et al. [23] who also
found an improved dose gradient and normal tissue brain sparing
with 6 MV FFF when compared to 10 MV FFF.
Conclusion
The current study evaluated dose-volume metrics (V8 and V12),
delivery times, and relevant dosimetric indices such as PCI, RTOG_CI, and PGI to characterize dose distribution in MIMT and SIMT
treatment plans. This study can help planners better inform as to
what can be attained using single isocenter or multiple isocenter to treat multiple intracranial lesions. The main aspect of this
study is showing the impact of energy and grid size on dosimetric
indices which can be used as a guideline regarding using different
energies and grid size. According to our data, there is some advantage of using 6MV FFF with 1 mm grid size which results in higher plan quality. Also, our result revealed that the isocenter location
does not have any significant impact on quality of the plan. The
number of targets seemed to have the largest impact on plan quality in this study, but volume is clearly a factor in improving conformity. We believe that considering all dosimetric indices, together
with time considerations, this study reveals an advantage of SIMT
planning for ≤6 intracranial targets.
Declarations
Funding: None to Report.
Conflict of Interest: None to Report.
Ethics approval: Approval from the Internal Review Board (IRB)
of the University of Toledo (300579-UT) was acquired for this investigation on June 16th, 2021.
Acknowledgment: The authors would like to express their sincere thanks for useful discussions with Nicholas Sperling, Ph.D.
References
- Patchell RA. The management of brain metastases. Cancer Treat
Rev. 2003; 29: 533-540.
- Amaya D, Shinde A, Wohlers C, Wong KCC, Novak J, et al. Dosimetric comparison of multiple vs single isocenter technique for linear
accelerator-based stereotactic radiosurgery: The Importance of
the six degree couch. J Appl Clin Med Phys. 2021; 22: 45-49.
- Ruggieri R, Naccarato S, Mazzola R, Ricchetti F, Corradini S, et al.
Linac-based VMAT radiosurgery for multiple brain lesions: comparison between a conventional multi-isocenter approach and a new
dedicated mono-isocenter technique. Radiat Oncol. 2018; 13: 38.
- Salari E, Parsai EI, Shvydka D, Sperling NN. Evaluation of parameters affecting gamma passing rate in patient-specific QAs for multiple brain lesions IMRS treatments using ray-station treatment
planning system. J Appl Clin Med Phys. 2022; 23: e13467.
- Que W, Kung J, Dai J. ‘Tongue-and-groove’ effect in intensity modulated radiotherapy with static multileaf collimator fields. Phys
Med Biol. 2004; 49: 399-405.
- Masi L, Doro R, Favuzza V, Cipressi S, Livi L. Impact of plan parameters on the dosimetric accuracy of volumetric modulated arc
therapy. Med Phys. 2013; 40: 071718.
- Morrison J, Hood R, Yin FF, Salama JK, Kirkpatrick J, et al. Is a single
isocenter sufficient for volumetric modulated arc therapy radiosurgery when multiple itracranial metastases are spatially dispersed? Med Dosim. 2016; 41: 285-289.
- Shaw E, Kline R, Gillin M, Souhami L, Hirschfeld A, et al. Radiation
Therapy Oncology Group: radiosurgery quality assurance guidelines. Int J Radiat Oncol Biol Phys. 1993; 27: 1231-1239.
- Paddick I. A simple scoring ratio to index the conformity of radio-surgical treatment plans. Technical note. J Neurosurg. 2000; 93:
219-222.
- Paddick I, Lippitz B. A simple dose gradient measurement tool to
complement the conformity index. J Neurosurg. 2006; 105: 194-201.
- Blonigen BJ, Steinmetz RD, Levin L, Lamba MA, Warnick RE, et al.
Irradiated volume as a predictor of brain radionecrosis after linear
accelerator stereotactic radiosurgery. Int J Radiat Oncol Biol Phys.
2010; 77: 996-1001.
- VanderSpek L, Wang J, Alksne J, Murphy KT. Single Fraction, Single
Isocenter Intensity Modulated Radiosurgery (IMRS) for Multiple
Brain Metastases: Dosimetric and Early Clinical Experience. International Journal of Radiation Oncology, Biology, Physics. 2007; 69:
S265.
- Clark GM, Popple RA, Young PE, Fiveash JB. Feasibility of single-isocenter volumetric modulated arc radiosurgery for treatment of
multiple brain metastases. Int J Radiat Oncol Biol Phys. 2010; 76:
296-302.
- Prentou G, Koutsouveli E, Pantelis E, Papagiannis P, Georgiou E,
et al. Influence of multiple brain metastases’ size and number on
the quality of SRS – VMAT dose delivery. Journal of Physics: Conference Series. 2017; 931: 012022.
- Kang J, Ford EC, Smith K, Wong J, McNutt TR. A method for optimizing LINAC treatment geometry for volumetric modulated arc
therapy of multiple brain metastases. Med Phys. 2010; 37: 4146-4154.
- Wu Q, Snyder KC, Liu C, Huang Y, Zhao B, et al. Optimization of
Treatment Geometry to Reduce Normal Brain Dose in Radiosurgery of Multiple Brain Metastases with Single-Isocenter Volumetric
Modulated Arc Therapy. Sci Rep. 2016; 6: 34511.
- Liu H, Andrews DW, Evans JJ, Werner-Wasik M, Yu Y, et al. Plan
Quality and Treatment Efficiency for Radiosurgery to Multiple
Brain Metastases: Non-Coplanar RapidArc vs. Gamma Knife. Front
Oncol. 2016; 6: 26.
- Clark GM, Fiveash JB, Prendergast BM, Willey CW, Spencer SA, et
al. Dosimetric Impact of Patient Rotational Setup Errors with Frameless Single-Isocenter, Multi-Target Volumetric Modulated Arc
Radiosurgery for Multiple Brain Metastases. International Journal
of Radiation Oncology, Biology, Physics. 2011; 81: S888.
- Aoki K, Nagatani Y, Noma K, Tsugawa T, Kono N, et al. Effective
Control of Brain Metastases Irrespective of Distance from Isocenter in Single-isocenter Multitarget Stereotactic Radiosurgery. Anticancer Res. 2021; 41: 2575-2581.
- Kraft J, van Timmeren JE, Mayinger M, Frei S, Borsky K, et al. Distance to isocenter is not associated with an increased risk for local failure in LINAC-based single-isocenter SRS or SRT for multiple
brain metastases. Radiother Oncol. 2021; 159: 168-175.
- Clark GM, Popple RA, Prendergast BM, Spencer SA, Thomas EM,
et al. Plan quality and treatment planning technique for single
isocenter cranial radiosurgery with volumetric modulated arc therapy. Pract Radiat Oncol. 2012; 2: 306-313.
- Palmer JD, Sebastian NT, Chu J, DiCostanzo D, Bell EH, et al. Single-Isocenter Multitarget Stereotactic Radiosurgery Is Safe and Effective in the Treatment of Multiple Brain Metastases. Adv Radiat
Oncol. 2020; 5: 70-76.
- Laoui S, Roa DE, Kuo J, Baldytchev M, Gonzales J, et al. Flattening
filter free beam energy selection and its impact in multitarget intracranial stereotactic radiosurgery treatments. Med Dosim. 2020;
45: 363-367.
- Lai Y, Chen S, Xu C, Shi L, Fu L, et al. Dosimetric superiority of flattening filter free beams for single-fraction stereotactic radiosurgery
in single brain metastasis. Oncotarget. 2017; 8: 35272-35279.
- Snyder Karen C, Liu M, Zhao B, Huang Y, Ning W, et al. Investigating the dosimetric effects of grid size on dose calculation accuracy
using volumetric modulated arc therapy in spine stereotactic radiosurgery. J Radiosurg SBRT. 2017; 4: 303-313.