Introduction
External beam radiotherapy (EBRT), brachytherapy (BT), and a
combination of BT with EBRT are among common treatments for
clinically localized low- to intermediate-risk prostate cancer (PCa)
[1-3]. Radical prostatectomy, androgen deprivation therapy and
cryoablation are alternative treatment options for this localized
disease [4]. Published studies reveal variations in treatment
approaches, both in total radiation dose delivered to the prostate
and in efficiency of the treatment [5-8]. Therefore, assessment
of prostate response to radiotherapy (RT) is still investigational
pending long-term prospective comparative data [9].
Response to RT is routinely evaluated by assessing changes in
prostate-specific antigen (PSA) levels in serum before and after
RT. After therapy, PSA levels can transiently increase (the so-called
PSA bounce phenomenon) before dropping below the nadir
values before intervention [10]. Biochemical failure after RT occurs
in 30-50% of the patients [11,12]. This failure initiates further
examinations with the aim to confirm or exclude PCa recurrence.
Transrectal ultrasound-guided sextant biopsy is the current
standard for histological verification of local PCa recurrence [13].
This is an invasive approach and can be inaccurate in the depiction
of some tumors as only a fraction of the prostate gland is sampled.
Magnetic resonance imaging (MRI) and proton (1H) magnetic
resonance spectroscopy (1H-MRS) are frequently used as
complementary approaches to ultrasound-guided sextant biopsy
for the detection and localization of PCa before and after RT.
Whilst standard T2
-weighted MR imaging is useful for anatomical
detection and localization of suspicious lesions before RT, its
ability to identify PCa post-therapy is considerably limited due
to loss of zonal anatomy and diffuse reduction of T2
-weighted
signal caused by therapy-induced glandular atrophy and fibrosis
[5,6,13]. Currently, diffusion weighted imaging (DWI) is frequently
used in addition to T2
-weighted sequences both for diagnostic and
surveillance purposes. The apparent diffusion coefficient (ADC)
maps derived from DWI, when used as an adjunct to weighted
images, have been shown to be invaluable for identifying recurrent
PCa lesions larger than 0.4 cm2
[14]. Furthermore, 3D magnetic
resonance spectroscopic imaging (3D MRSI) improves detection
and localization of PCa before therapy and has shown good
potential to recognize residual and recurrent PCa after therapy
[5,6,8,13]. 3D MRSI may confirm successful radiation treatment
by identifying metabolic atrophy (MA) that reflects decrease and/
or loss of prostatic metabolites [5,6,15-17]. Prostatic metabolites
that MR spectroscopy can detect and quantify are total choline
(Cho), polyamines (PA) (mainly spermine), total creatine (Cr) and
citrate (Cit). Elevated Cho, and reduced PA and Cit are recognized
as markers for prostate malignancy.
Most studies that performed 3D MRSI examinations of the
prostate, used an endorectal coil in combination with a phasedarray surface coil. A typical nominal voxel size in these studies
ranged between 5x5x5 mm3
and 7x7x7 mm3
[18,19]. One major
disadvantage of 3D MRSI is the necessity to use an inflatable
endorectal receiver coil to achieve sufficient signal-to-noise ratio
(SNR) within a clinically acceptable scanning time. However,
endorectal coils cannot be used during RT as well as during the
first 1-2 months after RT. The endorectal coil is contraindicated in
patients with rectal bleeding, severe hemorrhoids, painful rectal fissures, Crohn’s disease, and ulcerative colitis. Some patients
are also reluctant to repeat the examination with an endorectal
coil because insertion of the coil into rectum is an unpleasant or
painful procedure [5,19].
The main goal of this study was assessment of prostate
metabolic activity using single-voxel MRS and evaluation of ADC
variations before, during and three months after the completion
of BT and/or EBRT. The second aim was to investigate both
methods in assessing the response of prostate tissues to RT.
Materials and methods
Patients
Seven patients with biopsy-proven localized T1cN0M0
intermediate-risk PCa participated in this study (Table 1). Two
patients (nr 1 and 2) received combined BT and EBRT and five
were treated by EBRT only. Three patients received short-course
neo-adjuvant androgen-deprivation therapy (ADT) before the
start of therapy. Patients nr 1 and 7 were treated by bicalutamide
and finasteride and patient nr 3 had received a combination of
bicalutamide and tamoxifen. None of the other patients (nr 2,4,5,
6) had received any other treatment for PCa prior to therapy. The
local ethical committee approved this study and written informed
consent was obtained from all participants before commencing
the study.
Radiotherapy
Brachytherapy was performed under local anesthesia.
Transrectal ultrasound imaging was used to guide positioning of
the BT sources in prostate. Two high-dose rate (Ir-192) BT sessions
were performed fortnightly delivering a dose of 20 Gy (10 Gy/
fraction) to the whole prostate and the base of seminal vesicles.
Linac-based conventional EBRT followed a day after BT delivering
a dose of 50 Gy in 25 fractions. External RT was delivered with
volumetric modulated arc therapy (6 MV) in patients nr 1 and 2
resulting in a total delivered nominal dose of 70 Gy. Patients nr 3-7
were treated with EBRT only, receiving a ultra hypo-fractionated
regimen of 42.7 Gy in 7 fractions [20] using 1.5T MR-Linac (Unity,
Elekta AB, Stockholm, Sweden). Here, RT was delivered with
step-and-shoot intensity modulated technique (IMRT, 7 MV)
under daily MR imaging. Target and organ-at-risk structures were
adapted to the daily inner anatomy as observed in the MR images
and a new RT plan was optimized and delivered at each fraction
according to an MR-guided adaptive RT workflow for Unity [21].
Data acquisition
MR examinations of all patients were performed on a 3T clinical
scanner (Elition, Philips Healthcare, Best, the Netherlands).
MRI acquisitions were performed about one week before the
treatment (BT or EBRT), after first BT, twice during EBRT, and about
3 months after RT. A 32-channel receiver phased-array surface
coil was used for imaging and spectroscopy. Sagittal, coronal, and
axial T2
-weighted turbo spin echo images were acquired to guide
positioning of the spectroscopic voxel position (TR/TE=3758/110
ms; field of view (FOV)=160x160 mm2
; acquisition matrix=200
x157; slice thickness=3 mm; SENSE factor=1.3; bandwidth/
pixel=220.1 Hz; number of signal averages (NSA)=1). Diffusionweighted images were acquired by single-shot spin-echo with an
echo-planar readout (SE-EPI) sequence (TR/TE=3500/68 ms; FOV =160x160 mm1
; acquisition matrix=(64 x 64); slice thickness=3 mm;
slice gap=0 mm; SENSE factor=3; NSA=3; EPI bandwidth=1985
Hz; spectrally selective attenuated inversion recovery (SPAIR) fat
suppression). Diffusion gradients were applied in three directions
using a range of b-values (b=0,100,250,400,600 s/mm2
). Axial
ADC maps were then computed from the diffusion data using the
vendor software which employed a mono-exponential fit.
Single-voxel spectroscopy was performed with the pointresolved spectroscopy (PRESS) sequence (TR/TE=1500/140 ms;
phase cycling=16). Sixteen non-water suppressed acquisitions
were followed by 384 water-suppressed scans. Magnetic field
homogeneity was improved by iterative first-order shimming.
Water suppression was performed by band selective pre-pulses
and by band-selective inversion with gradient dephasing (BASING)
pulses [22]. Fat suppression was achieved by a frequency-selective
inversion recovery pre-pulse. The largest possible voxel was placed
inside the prostate while minimizing inclusion of periprostatic fat.
For all patients, the shortest distance between the acquisition
voxel and eventual rectal air was roughly 10 mm. The total MRI
and MRS examination time including patient positioning was
approximately 35-40 minutes.
Data analysis
Since the entire prostate volume was treated by RT, the aim
of data analysis was to characterize radiation-induced changes in
the largest possible prostate volume. The five axial slices placed
at the center of prostate were used for evaluation of the ADC
values. We assumed that the slice positions were approximately
the same in the measurements before, during, and three months
after the end of the therapy. Regions of interest (ROIs) were
drawn manually and encompassed the whole peripheral zone
and the central gland. Great attention was paid to exclude the
neurovascular bundle around the prostate and urethra (if visible).
ADC values were quantified in all five slices and the average value
was calculated. Benign and malign prostate tissues were not
evaluated separately.
All spectra were processed in LCModel v. 6.3-1K [23]. Unlike
other spectrum processing software, LCModel does not utilize
apodization of the time domain signal to improve SNR. LCModel
utilizes an algorithm that fits prostate spectrum with simulated
Cho, PA, Cr, and Cit spectral lines as the prior knowledge.
Reliability of the spectral line fit is given by a standard deviation
(Cramér-Rao lower bound) expressed in percent of the estimated
concentrations. A CRLB<20% is usually used as a criterion that
the spectral line fit is of acceptable reliability. The metabolite
is practically undetectable if CRLB>40%. Based on LCModel
vendor recommendation, a SNR>3 was used as a criterion of
prostate spectrum acceptance. Total Cho, PA, total Cr, and Cit
quadruplet were fitted in LCModel. Spectral intensity ratios Cho/
(PA+Cr) were evaluated instead of Cho/Cr because separation of
PA and Cr spectral lines was unreliable. Since Cit intensity can
potentially decrease to the noise level at the end of therapy, the
Cit/(Cho+PA+Cr) spectral intensity ratio was evaluated instead
of (Cho+PA+Cr)/Cit. Furthermore, radiation therapy-induced
changes of Cho spectral line is more difficult to evaluate. Since PA
decreases during the therapy and Cr cannot be fitted accurately
due to overlapping with PA line, Cho/Cr ratio cannot be quantified
reliably. Also Cho to unsuppressed water line cannot be quantified reliably because prostate water concentration is not constant
during the therapy. To overcome these difficulties, the SNR of
the Cho spectral line was used as a measure of Cho intensity.
To justify such assumption, it was assumed that the distance
between the surface coil and prostate was almost constant for
all measurements and that the voxel volume was unchanged.
The former was possible to achieve with reasonable accuracy by
placing the center of the surface coil directly above the prostate
and also the fact that patient shape did not change during the
therapy.
Statistics
The reported values are given as the mean ±1 SD.
Result
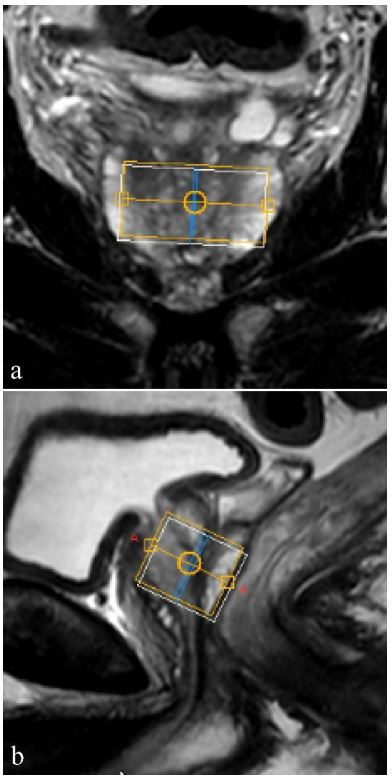
Single-voxel spectroscopy was succesfully performed for all
patients. All acquired spectra had a SNR>3 (range 4-15). The mean
voxel size and water linewidth after shimming were 18.1±5.5
cm3
, and 16.5±3.9 Hz, respectively. A typical voxel position in the
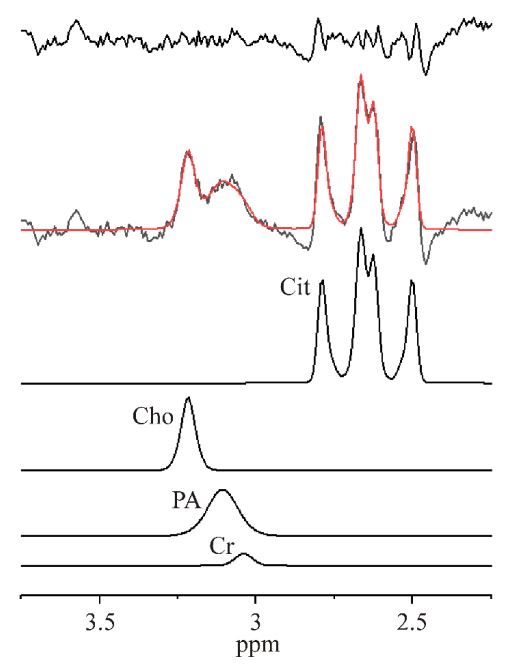
prostate is shown in Figure 1. The processed spectrum of patient
nr 1 before therapy is shown in Figure 2. It can be seen from
Figure 2 that despite having a very good spectrum quality (SNR
= 6), Cr was fitted unreliably (CRLB>40%). However, the sum of
PA+Cr spectral line fit was reliable (CRLB=10%). The spectra of
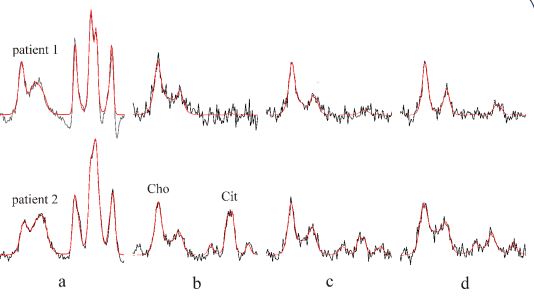
patients nr 1 and 2 treated with BT and EBRT are shown in Figure
3. The intensities of PA and Cit are noticeably decreased after the
second BT (Figure 3c). Spectral intensity of Cit dropped almost to
the noise level three months after the end of EBRT for both of
the patients (Figure 3d). At the same time, PSA levels dropped
from 2,1 and 3,3 ng/mL prior to therapy to 0.5 and 0,9 ng/mL,
respectively at three months follow-up (Table 1) indicating a
relationship between the decreased Cit intensity and a very
good initial biochemical response of prostate to the combined
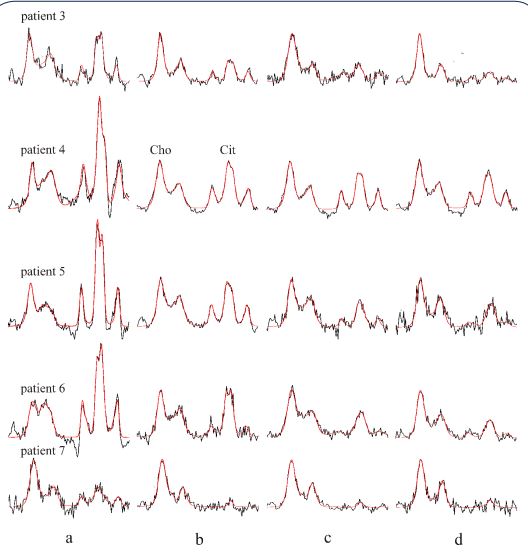
treatment. Spectra of the patients treated only by EBRT are shown
in Figure 4. These spectra reveal gradual decrease of PA and Cit
intensities. Compared to the initial values shown in Figure 4a,
the levels of Cit decreased considerably three months after the
end of EBRT (Figure 4d). This together with declining PSA levels
(Table 1) reveal an apparent biochemical response to therapy.
The exception was patient nr 4, whose spectum is shown in Figure
4d, with a relatively high Cit intensity three months after the end
of EBRT. This demonstrates the worst metabolic response to the
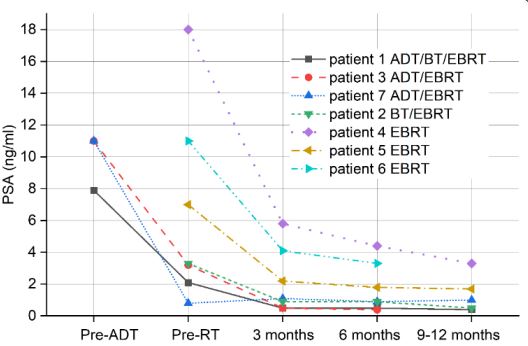
EBRT in our patient population. Interestingly, the same patient
had a relatively high PSA values at 9 months standard follow-up
(Figure 5). Mean Cho/(PA+Cr) spectral intensity ratio of all patients
before therapy was 0.59±0.36 increasing to 1.17±0.5 three
months after the end of therapy. Mean Cit/(Cho+PA+Cr) ratio of
all patients with the exception of patient nr 4 was 0.32±0.13 three
months after the end of therapy. The excluded patient nr 4 had a
ratio of 0.79. This strengthens our belief that a good response to
therapy might be quantitavely expressed by the spectral intensity
ratio Cit/(Cho+PA+Cr)<0.32±0.13. SNR of the Cho spectral line
was evaluated as a measure of Cho concentration. The condition
of constant voxel volume during all measurements was met in
patients nr 1,2,3,5, and 7. SNR difference of Cho lines between
the first irradiations (Figures 3b and 4b) and three months after
the end of the therapy (Figures 3d and 4d) was in the range ±1,
while mean Cho SNR of the patients during the same period was
5.2±0.9 (range 4-7).
PSA values of the patients before the start of androgendeprivation therapy (ADT) or before the start of RT, respectively.
PSA values where evaluated 3,6 months, and 9-12 months after
the EBRT.
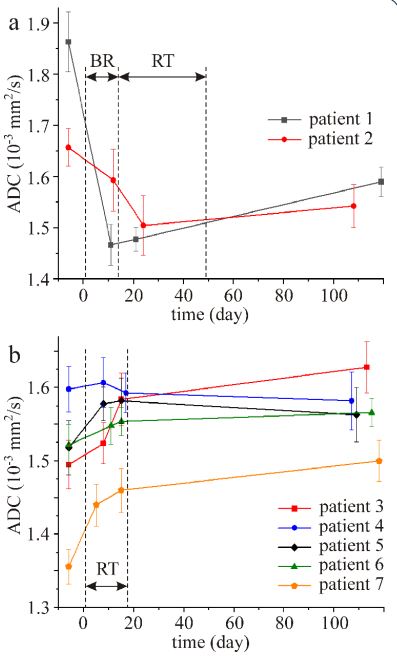
The time course of prostate ADC values for all patients is shown
in Figure 6. The first measurements were performed one week
(day-6) before the start of therapy and the last measurements
were performed ~3 months after the end of therapy. As indicated
in Figure 6, therapy started on day 1. It is inferred from Fig 6
that BT resulted in a fast decrease of ADC values followed by an
increase. On the contrary, the ADC values of the patients treated
only by EBRT increased during the therapy (Figure 6b). The only
exception was patient nr 4 where ADC values did not change
during the therapy taking into consideration standard deviations.
The increase of ADC values three months after the end of therapy
compared to the values before therapy was insignificant (p>0.05).
Discussion
Radiation-induced metabolic response in prostate after RT
has attracted scientific attentions to explore its predictive value
in treatment of PCa. In this work, surveillance of prostate metabolic changes for two RT strategies (EBRT + BT vs EBRT only) was
performed pre, per- and post-treatment using single-voxel spectroscopy. To the best of our knowledge, this is the first report of
its kind where RT was monitored by single-voxel spectroscopy
without the need for the use of an endorectal receiver coil. High
quality spectra were acquired in a short measurement time and it is our belief that omitting the endorectal coil from the workflow, was the only acceptable alternative for the recruitment of
patients with PCa undergoing RT.
Previous prostate MR spectra of patients treated by EBRT or
ADT were performed exclusively with 3D MRSI techniques [3,5,
15-18]. The examinations required an endorectal coil in combination with a phased-array surface coil and their main purpose
was detection of residual or recurrent PCa after therapy [3,5,8,
13] and verification of successful treatment by identifying metabolic atrophy. However, all reported spectra from small 3D MRSI
voxels had poor SNR. Therefore, noise suppression was an inevitable step in spectrum processing, which resulted in a decrease in
spectral resolution. In some studies, Cho, PA and Cr spectral lines
were indistinguishable [5,15,17].
The term “metabolic atrophy” (MA) was first introduced by
Mueller-Lisse et al in 2001 [15]. The authors identified the presence of MA in voxels where (Cho+Cit) intensity (peak area) ratio
to noise was less than 5. They proposed that complete MA was
achieved when spectral intensities of all detectable metabolites
were less than 5 SD of the noise level. The definition of MA was
further enhanced by Pickett et al [5] and Valentini et al [6] where
the occurrence of MA was defined as the (Cho+PA+Cr+Cit) intensity ratio to noise was less than 5. The very last MA definition was
proposed by Panebianco et al [17] as the spectral intensity ratio
(Cho+PA+Cr)/Cit<0.2. There are drawbacks associated with all definitions. SNR is an unreliable reference to the spectral intensities
because it is influenced by additional factors. SNR is dependent
on the distance between surface coil and prostate, which in turn
depends on patient shape and size. Other critical factors are voxel
size, number of signal averages and TR. In addition, SNR is first
suppressed in vendor-dependent spectrum processing and then
used as a noise reference [5,6,15]. The definition of Panebianco et
al. [17] is also problematic because Cit intensity can be very low or
undetectable at the end of the RT or indeed a few months after.
Table 1: Patients’ characteristics.
| Patient nr |
Age (years) |
Gleason score |
Dominant tumor size (cm)
|
Radiation dose (Gy) |
Treatment |
PSA Pre-ADT |
PSA Pre-RT |
PSA 3 months after RT |
| 1 |
60 |
3+4 |
1 |
70 |
ADT/BT/ EBRT |
7.9 |
2.1 |
0.5 |
| 2 |
57 |
4+3 |
1 |
70 |
BT/EBRT |
|
3.3 |
0.9 |
| 3 |
76 |
4+3 |
2.3 |
42.7 |
ADT/EBRT |
11.0 |
3.2 |
0.5 |
| 4 |
74 |
4+3 |
0.9 |
42.7 |
EBRT |
|
18 |
5.8 |
| 5 |
75 |
4+3 |
1.2 |
42.7 |
EBRT |
|
7.0 |
2.2 |
| 6 |
75 |
4+3 |
1.1 |
42.7 |
EBRT |
|
11.0 |
4.1 |
| 7 |
67 |
3+4 |
0.8 |
42.7 |
ADT/EBRT |
11.0 |
0.8 |
1.1 |
ADT: Androgen deprivation therapy; BT: Brachytherapy; EBRT: External beam radiotherapy; PSA levels in ng/ml.
PA and Cit are the most sensitive metabolites to RT. Both
metabiltes are produced by epithelial cells and stored in the luminal compartments. A high level of PA and Cit intensities reveal an
active prostate metabolism. PA and Cit decrease in malign prostate tissues due to invasion of secretory ducts by cancer cells and
also by decrease of luminal volume. Further decrease of PA and
Cit is caused by reduced production of spermine by cancer cells
and by Cit oxidation due to the neoplastic cells failure to accumulate zinc [24,25]. Our results have demonstrated that PA and Cit
intensities were reduced very fast due to irradiation damage of
healthy secretory epithelial cells which go first to apoptosis. The
consequence was an increase of Cho/(PA+Cr) ratio and decrease
of Cit/(Cho+PA+Cr) spectral intensity ratio.
Previous studies reported radiotherapy-induced decrease of
Cho (cell membrane constituent) and Cr intensities in addition to
the much faster reduction of PA and Cit spectral lines [5,6,15-17].
To verify the decrease of Cho spectral intensity, we used SNR of
the Cho spectral line as a measure of the Cho content. For each
patient, only minimal differences were found between Cho SNR
after the first irradiation fractions (Figures 3b and 4b) and SNR
three months after the end of therapy (Figures 3d and 4d). In
other words, RT induced changes in Cho concetration were very
small (if any). One can therefore conclude that the reduction of
Cit intensity close to the noise level seems to be the most reliable
measure for identification of metabolic atrophy and response to
therapy. In our patient population, complete metabolic atrophy, which is defined as a loss of all prostate spectral intensities, was
not reached. We believe that complete metabolic atrophy is an
unattainable goal in current standard radiation treatment, which
is also reflected by the PSA levels after RT (Figure 5).
ADC time course of prostate treated by a combined BT and
EBRT (Figure 6a) was qualitatively different compared to the ADC
time course of the patients treated only by a ultra-hypo-fractionated EBRT regimen (Figure 6b). Brachytherapy caused rapid decrease of ADC values. Restricted diffusion of the free water molecules was most likely caused by decrease of extracellular space
due to hemorrhage and inflammatory swelling of cells associated
with BT. On the contrary, ADC values increased during EBRT and
were higher three months after the end of the therapy compared
to the values before therapy (Figure 6b). This increase in ADC in
both PCa and benign tissues was also observed in previous studies [12,26-28]. Post-radiation ADC increase is usually explained by
changes characterized by lower cellularity associated with glandular atrophy and fibrosis. In our studied population, surveillance
of both metabolic and ADC changes during and after RT in patient 4 revealed a somewhat aberrant profile. Interestingly, the
long term declining of his PSA levels were relatively slow reaching
to 3,3 ng/ml at 9 months follow-up (Figure 5). In the study of 18
patients with PCa who received non-ADT EBRT, Chow et al. [29]
found that all the patients without biochemical recurrence had a
9 months PSA levels <1.0 ng/ml. Hence, longer surveillance of this
patient should reveal the predictive value of the observed metabolic changes of the prostate in this particular case.
The main limitation of the present work is the small number
of patients. We had originally intended to examine five patients
treated by combined BT and EBRT and five patients treated only
by EBRT but our efforts were hampered by the COVID-19 pandemic. Therefore, only two patients with combined BT and EBRT
were available for our evaluations. Further limitation of this work
is that the metabolic profile and ADC values were analysed for the
whole prostatic tissue and not specifically the tumour lesions or
benign tissue. However, we believe that reactions in the whole
prostate can be used as a surrogate for metabolic changes in the
tumour tissues as well. Our last measurements were performed
three months after the end of the therapy, which clinically is too
short to verify a long-term response to RT. Thus, results of this
study require confirmation in a larger cohort of patients with a
longer (2-3 years) follow-up period.
Conclusion
Single-voxel spectroscopy is a useful tool for monitoring metabolic changes in prostate treated with BT and/or EBRT. Our results
suggest that a biochemical response to RT of intermediate-risk
PCa, might be characterized by low Cit intensity and an increase
in ADC after the treatment. On the other hand, higher Cit intensity and negligible changes of ADC values after the end of therapy
compared to the values before therapy suggest poor biochemical response to the treatment. Spectroscopic data of metabolic
activity may provide important predictive information following
RT. Future work is intended to investigate the role of single-voxel
spectroscopy in assessing the response of prostate to RT in a larger cohort of patients.
Declarations
Conflict of interest: Authors declare no conflict of interest.
Funding: This study was supported by Foundation of Department of Oncology, University Hospital, Uppsala, Sweden.
Acknowledgement: We would like to thank the coordinator personnel and oncologist colleagues for their involvement in
booking, recruiting and follow-up of the patients.
References
- Gwede CK, Pow-Sang J, Seigne J, Heysek R, Helal M, Shade K, et al. Treatment decision-making strategies and influences in patients with localized prostate carcinoma. Cancer. 2005; 104: 1381-1390.
- Vulto JC, Lybeert ML, Louwman MW, Poortmans PM, Coebergh JW. Population-based study of trends and variations in radiotherapy as a part of primary treatment of cancer in the southern Netherlands between 1988 and 2006, with an emphasis on breast and rectal cancer. Int J Radiat Oncol Biol Phys. 2009; 74: 464-471.
- Albertsen PC, Hanley JA, Penson DF, Barrows G, Fine J. 13-year outcomes following treatment for clinically localized prostate cancer in a population based cohort. J Urol. 2007; 177: 932-936.
- Wilt TJ, Thompson IM. Clinically localised prostate cancer. BMJ. 2006; 333: 1102-1106.
- Pickett B, Kurhanewicz J, Coakley F, Shinohara K, Fein B, Roach M. Use of MRI and spectroscopy in evaluation of external beam radiotherapy for prostate cancer. Int J Radiation Oncology Biol Phys. 2004; 60: 1047-1055.
- Valentini AL, Benedetta G, D’Agostino GR, Mattiucci G, Clementi V, Di Molfetta IV. Locally advanced prostate cancer: Three-dimensional magnetic resonance spectroscopy to monitor prostate response to therapy. Int J Radiation Oncology Biol Phys. 2012; 84: 719-724.
- Song I, Kim CK, Park BK, Park W. Assessment of response to radiotherapy for prostate cancer: Value of diffusion-weighted MRI at 3 T. Am J Roentgenol. 2010; 194: W477-482.
- Kirilova A, Damyanovich A, Crook J, Jezioranski J, Wallace K, Pintilie M. 3D MR-spectroscopic imaging assessment of metabolic activity in the prostate during the PSA “bounce” following 125Iodine brachytherapy. Int J Radiation Oncology Biol Phys. 2011; 79: 371-378.
- Sandhu S, Moore CM, Chiong E, Beltran H, Bristow RG, Williams SG. Prostate cancer. Lancet. 2021; 398: 1075-1090.
- Kishan AU. PSA bounce, prognosis, and clues to the radiation response. Prostate Cancer and Prostatic Diseases. 2021; 24: 937–938.
- Kuban DA, Thames HD, Levy LB, E, Horwitz EM, Kupelian PA, Martinez AA, et al. Long-term multi-institutional analysis of stage T1-T2 prostate cancer treated with radiotherapy in the PSA era. Int J Radiation Oncology Biol Phys. 2003; 57: 915-928.
- Kim CK, Park BK, Lee HM. Prediction of locally recurrent prostate cancer after radiation therapy: Incremental value of 3T diffusionweighted MRI. J Magn Reson Imag. 2009; 29: 391-397.
- Westphalen AC, Coakley FV, Roach M, McCulloch CE, Kurhanewicz J. Locally recurrent prostate cancer after external beam radiation therapy: Diagnostic performance of 1.5-T endorectal MR imaging and MR spectroscopic imaging for detection. Radiology. 2010; 256: 485-492.
- Morgan VA, Riches SF, Giles S, Dearnaley D, deSouza NM. Diffusion-weighted MRI for locally recurrent prostate cancer after external beam radiotherapy. Am J Roentgenol. 2012; 198: 596-602.
- Mueller-Lisse UG, Swanson MG, Vigneron DB, Hricak H, Bessette A, Males RG, et al. Time-dependent effects of hormone deprivation therapy on prostate metabolism as detected by combined magnetic resonance imaging and 3D magnetic resonance spectroscopic imaging. Magn Reson Med. 2001; 46:49-57.
- Mueller-Lisse UG, Swanson MG, Vigneron DB, Kurhanewicz J. Magnetic resonance spectroscopy in patients with locally confined prostate cancer: Association of prostatic citrate and metabolic atrophy with time on hormone deprivation therapy, PSA level, and biopsy Gleason score. Eur Radiol. 2007; 17: 371-378.
- Panebianco V, Barchetti F, Musio D, Forte V, Pace A, De Felice F, et al. Metabolic atrophy and 3-T 1H-magnetic resonance spectroscopy correlation after radiation therapy for prostate cancer. BJU Int. 2014; 114: 852-859.
- Kobus T, Vos PC, Hambrock T, De Rooij M, Hulsbergen-Van de Kaa CA, Barentsz JO, et al. Prostate cancer aggressiveness: In vivo assessment of MR spectroscopy and diffusion-weighted imaging at 3 T. Radiology. 2012; 265: 457-467.
- Weis J, von Below C, Tolf A, Ortiz-Nieto F, Wassberg C, Häggman M, et al. Quantification of metabolite concentrations in benign and malignant prostate tissues using 3D proton MR spectroscopic imaging. J Magn Reson Imaging. 2017; 45: 1232-1240.
- Widmark A, Gunnlaugsson A, Beckman L, Thellenberg-Karlsson C, Hoyer M, Lagerlund M, et al. Ultra-hypofractionated versus conventionally fractionated radiotherapy for prostate cancer: 5-year outcomes of the HYPO-RT-PC randomised, non-inferiority, phase 3 trial. Lancet. 2019; 394: 385-395.
- Winkel D, Bol GH, Kroon PS, van Asselen B, Hackett SS, Werensteijn-Honingh AM, et al. Adaptive radiotherapy: The Elekta Unity MRlinac concept. Clin Transl Radiation Oncology. 2019; 18: 54-59.
- Star Lack J, Nelson SJ, Kurhanewicz J, Huang LR, Vigneron DB. Improved water and lipid suppression for 3D PRESS CSI using RF band selective inversion with gradient dephasing (BASING). Magn Reson Med. 1997; 38: 311-321.
- Provencher SW. Estimation of metabolite concentrations from localized in vivo proton NMR spectra. Magn Reson Med. 1993; 30:672-679.
- Smith RC, Litwin MS, Lu Y, Zetter BR. Identification of an endogenous inhibitor of prostatic carcinoma cell growth. Nat Med. 1995; 1: 1040-1045.
- Micielska ME, Patel A, Rizaner N, Mazurek MP, Keun H, Patel A, et al. Citrate transport and metabolism in mammalian cells. BioEssays. 2009; 31: 10-20.
- Sato C, Naganawa S, Nakamura T, Kumada H, Miura S, Takizawa O, et al. Differentiation of non-cancerous tissue and cancer lesions by apparent diffusion coefficient values in transition and peripheral zones of the prostate. J Magn Reson Imaging. 2005; 21: 258-262.
- Westphalen AC, Galen DR, Vinh PP, Sotto C, Vigneron DB, Kurhanewicz J. Multiparametric 3T endorectal MRI after external beam radiation therapy for prostate cancer. J Magn Reson Imaging. 2012; 36: 430-437.
- Takayama Y, Kishimoto R, Hanaoka S, Nonaka H, Kandatsu S, Tsui H, et al. ADC value and diffusion tensor imaging of prostate cancer: changes in carbon-ion radiotherapy. J Magn Reson Imaging. 2008; 27: 1331-1335.
- Chow PM, Chiang IN, Cheng JCH, Chiang BJ, Pu YS, Huang CY. Pretreatment prostate specific antigen (PSA) and 2-year PSA dynamics: Early predictors of prostate cancer prognosis with external radiation therapy. Urological Science. 2013; 24: 120-123