Introduction
In recent years MRI of the liver has established itself as the
imaging technique with the greatest diagnostic accuracy. It is the
method of choice for the diagnosis of liver malignancies [1], but
also achieves good results in the characterization of benign liver
lesions [2] or in the detection of liver metastases [3]. Therefore,
MRI is the most important imaging modality for the detection of
liver lesions besides ultrasound. In our institute at a tertiary care
center, approximately 9% (1363/15932) of all MRI examinations in 2021 were MRI of the liver.
MRI of the liver is typically performed multiparametrically with
i.v. contrast media (CM). Gadolinium-based contrast medias have
recently been evaluated more critically because of nephrogenic
systemic sclerosis and possible deposition in the brain and other
organs [4,5]. Thus, the question arose whether and in which clinical scenario multiparametric liver MRI would achieve identical
results without i.v. CM and thus CM administration could be omitted.
Material and methods
We retrospectively evaluated the native sequences from all
consecutive liver MRIs of patients aged 19 years and older who
were examined at our institute during a two-month period. If a
patient was examined more than once during this period, only the
first acquisition within the period was considered. All MRI examinations were performed on a 1.5 T scanner (MAGNETOM Aera,
Siemens Healthcare GmbH, Erlangen, Germany). The MR protocol
consisted of 5-6 pre-contrast sequences in transverse orientation
and 5 mm slice thickness: T2w with and without fatty saturation,
diffusion-weighted sequence with b values of 50,400, and 800,
T1w DIXON, and a coronary T2w sequence with 5 mm slice thickness. The T2w sequence with fat saturation was primarily measured as a turbo spin echo sequence with respiratory triggering.
If image quality was insufficient, a T2 HASTE sequence with fat
saturation was added. The diffusion-weighted imaging (DWI) sequence was measured in free breathing with breath triggering.
After CM application (Gadovist single dose, Bayer, Berlin, Germany), three transverse T1w-VIBE DIXON sequences were measured in arterial, portal venous, and late phase, a transverse T1w
FLASH sequence with fat saturation with a slice thickness of 5
mm, and a coronary T1w sequence with fat saturation and a slice
thickness of 5 mm. The measurement parameters of the sequences can be found in Table 1. The pre-CM sequences of all MRI scans
were re-analysed by two radiologists (B.I., resident with 1 year of
experience and R.J., specialist/supervisor with many years of experience) in consensus. Both evaluators were blinded to post-CM
measurements, patient history, diagnosis, and previous findings.
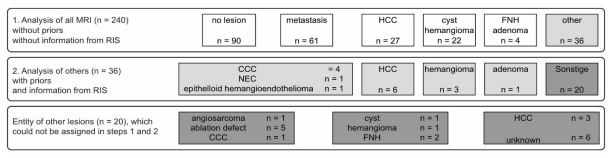
In the first step, all patients without lesions were identified
(group 1). Patients with at least one lesion were classified by consensus of the two evaluators into metastasis (group 2), hepatocellular carcinoma (group 3), cyst or hemangioma (group 4), focal
nodular hyperplasia (FNH) or adenoma (group 5) according to
the criteria in Table 2. The criteria are based on the knowledge
of the current literature [6]. The apparent diffusion coefficient
(ADC) value of diffusion-weighted sequences was not considered
because it is not valid for small lesions due to the potential difference in the respiratory position of each B-value measurement and
the overlap area of the different lesions is too large [7]. If a clear
classification into group 1 to 5 was not possible, the patients were
assigned to group 6 (other) (Figure 1).
If more than one lesion was present, assignment to the more
malignant group was made. For example, a case with hemangioma and hepatocellular carcinoma (HCC) was assigned to group
3. In routine clinical practice, all MRI evaluations, if available, use
the information from the preliminary images and the patient’s
record/clinical information to make their findings. Therefore, in a
2nd step, we re-evaluated all lesions that could not be assigned so
far (group 6) using the information from the radiological information system (RIS), the previous images and the electronic patient
record (“second native analysis”) (Figure 1). The lesions in group
2 (liver metastasis), group 3 (HCC), group 4 (cysts/hemangioma),
and group 5 (FNH/adenoma) were additionally further analysed
in terms of their number. More than 5 lesions were classified as
“multiple lesions” and counted as 5 lesions in the analysis. Group
3 (HCC) lesions were evaluated after unblinding with all available sequences and prior imaging according to the Liver Imaging Reporting and Data System (LI-RADS) criteria [8]. The original report with all sequences - native and after contrast administration
- served as reference and gold standard. Sensitivity, specificity,
positive predictive value, negative predictive value, and accuracy
of non-contrast images were calculated.
Results
From 09/25/2021 to 11/24/2021, 259 liver MRIs were performed in our institute on 240 adult patients (159 male, 81 female) with a mean age of 42±17 years. The indications for these liver MRIs were:
-Exclusion of liver metastases in patients with known malignant tumour disease such as breast carcinoma, colorectal carcinoma, gastric carcinoma, pancreatic carcinoma, or neuroendocrine
tumours (n=38).
-Follow-up of known liver metastases after medical treatment
or after non-treatment (n=68). 12/68 patients had previous ablation therapy.
-Detection of malignant liver-derived tumours, e.g., early detection of hepatocellular carcinoma (HCC) in patients with liver
cirrhosis or follow-up assessment of HCC with or without previous
treatment/intervention (n=84).
-Further diagnostic clarification in case of clinically, laboratorychemically or sonographically abnormal findings (n=50)
After evaluation of the precontrast images of all 240 MRIs, no
lesions were found in 90 patients (in the original findings n=84,
group 1). Liver lesions were detected in 150 patients (in original
findings n=156, groups 2 to 6). Liver metastases were detected
in 61 patients (in original report n=61, group 2), HCCs in 27 patients (in original report n=42, group 3), cysts/hemangiomas in
22 patients (in original report n=27, group 4), FNH/adenomas in 4
patients (in original report n=7, group 5). 36 patients could not be
classified into groups 2 to 5 and were assigned to under the group
“other” (in original findings n=19, group 6) (Figure 1; Table 3).
In the 36 patients with abnormal findings that could not be
natively assigned to an entity, clinical information was included in
the evaluation. With the help of information from RIS, previous
images (CT or MRI with i.v. CM) and the electronic patient record,
an entity of liver lesions could now be determined in 16 of 36
patients: HCC (n=6), hemangioma (n=3), adenoma (n=1), cholangiocellular carcinoma (CCC) (n=4), neuroendocrine carcinoma of
the gallbladder (NEC) (n=1), and epithelioid hemangioendothelioma (n=1). The diagnoses of the remaining 20/36 patients were
HCC (n=3), cyst (n=1), hemangioma (n=1), FNH (n=2), CCC (n=1,
diagnosis after biopsy), ablation defect (n=5), angiosarcoma (n=1,
diagnosis after biopsy), and unclear (n=6) in the original findings
considering CM sequences and biopsy results (Figure 1).
In 6 patients with HCC, no lesion was detected in the native
images and assigned to group 1 accordingly. Regarding the singlecell lesions, the results were as follows: In group 2 (liver metastases), all 268/268 lesions detected in the original findings could
be identified as liver metastases in 61 of 61 patients (Table 4).
In group 3 (HCC), 58/90 lesions were diagnosed as HCC in 33/42
patients (Table 4). The undetected 32/90 HCC lesions were classified as LI-RADS 3 in 13/35 (37%), LI-RADS 4 in 13/26 (50%), and LI-RADS 5 lesions in 6/29 (21%) (Table 5). In group 4 (cyst/hemangioma), 104/106 lesions were identified as cyst or hemangioma in
25/27 patients (Table 4). In group 5 (FNH or adenoma), 3/5 lesions
in 3/5 patients were detected as FNH and 10/10 lesions in 2/2
patients were detected as adenoma (Table 4). A detailed overview
of the achieved SE(%), SP(%), PPV(%), NPV(%) and accuracy of the
groups using native imaging is given in Table 6.
Table 1: Sequence parameters of liver MRI.
|
TR, TE (ms) |
Matrix |
FOV (mm) |
Slice thickness |
Orientation |
b-value |
| T2w TSE FS |
3700, 100 |
512 x 288 |
400 x 320 |
5 mm |
transversal |
|
| T2w HASTE FS |
1400, 92 |
256 x 198 |
400 x 325 |
5 mm |
transversal |
|
| T2w HASTE |
1400, 92 |
256 x 198 |
400 x 325 |
5 mm |
transversal |
|
| T1w VIBE DIXON |
7.2, 2.4/4.8 |
320 x 156 |
400 x 325 |
5 mm |
transversal |
|
| DWI FS |
2200, 56 |
268 x 216 |
380 x 306 |
5 mm |
transversal |
50, 400, 800 |
| T2w HASTE |
1100, 119 |
320 x 320 |
450 x 450 |
5 mm |
coronal |
|
|
Contrast media injection
|
|
T1w VIBE DIXON art., pv,
delayed
|
7.2, 2.4/4.8 |
320 x 156 |
400 x 325 |
5 mm |
transversal |
|
| T1w FLASH FS |
200, 7,2 |
256 x 208 |
400 x 325 |
5 mm |
transversal |
|
| T1w VIBE DIXON |
6.7, 2.4/4.8 |
288 x 259 |
450 x 450 |
5 mm |
coronal |
|
TSE: Turbo spin echo; HASTE: Half fourier single shot turbo spin echo; VIBE; Volumetric interpolated breath hold examination; DWI; Diffusion
weighted imaging; FLASH: Fast low angle shot; FS: Spectral fat saturation; ART: Arterial phase; PV: Portal venous phase; delayed: delayed phase.
Table 2: Signal characteristics of benign and malignant liver lesions in native MR seuqences.
| Lesion |
T1w |
T2w |
DWI b50 |
DWI b800 |
In/out-of-phase |
| Metastasis |
Hypointense(-) |
Hyperintense (+) (lower
signal than CSF).
|
+ |
+ |
/ |
| HCC |
Isointense(iso) to
surrounding liver tissue
|
iso/+ |
+ |
+ |
/ |
Cyst//
Hemangioma |
-/iso //
- |
Strongly hyperintense (++)
//
+/similar signal as
CSF
|
++ |
iso/+ |
/ |
| FNH |
-/iso to the surrounding
liver tissue
|
iso/+
and hyperintense
central scar
|
+ |
iso/+ |
/ |
| Adenoma |
iso to surrounding liver
tissue/ +
|
+ |
+ |
iso/+ |
Signal drop in the
opposed-phase
sequence
|
Table 3: Comparison of liver lesion assignment according to original findings and after 1st and
2nd analysis of native sequences of 240 patients with clinical data.
| Group |
Original findings |
1. Native analysis |
2. Native analysis |
| 1 - No lesion |
84 |
90 |
90 |
| 2 - Metastasis |
61 |
61 |
61 |
| 3 - HCC |
42 |
27 |
33 |
| 4 - Cyst/hemangioma |
27 |
22 |
25 |
| 5 - FNH |
5 |
3 |
3 |
| 5 - Adenoma |
2 |
1 |
2 |
| 6 - other |
19 |
36 |
26 |
| Total |
240 |
240 |
240 |
Table 4: Number of patients with 1 to ≥5 detected lesions in group 2 (metastasis), group 3 (HCC), group 4 (cyst/hemangioma), and group 5 (FNH/adenoma) after evaluation of all sequences (native+CM corresponds to original findings), and after reporting of native sequences only (na-
tive).
|
Metastasis |
HCC |
Cyst/hemangioma
|
FNH |
Adenoma |
|
Native+CM |
Native |
Native+CM |
Native |
Native+CM |
Native |
Native+CM |
Native |
Native+CM |
Native |
| 1 lesion |
17 |
17 |
15 |
13 |
12 |
10 |
5 |
3 |
- |
- |
| 2 lesions |
7 |
7 |
12 |
10 |
6 |
6 |
- |
- |
- |
- |
| 3 lesions |
6 |
6 |
4 |
0 |
1 |
1 |
- |
- |
- |
- |
| 4 lesions |
1 |
1 |
1 |
0 |
1 |
1 |
- |
- |
- |
- |
| ≥5 lesions |
43 |
43 |
7 |
5 |
15 |
15 |
- |
- |
2 |
2 |
Table 5: Number of HCC lesions found with all sequences
(native+CM) and exclusively the native sequences divided into LIRADS categories.
| n |
LR-3 |
LR-4 |
LR-5 |
Total |
| native + CM |
35 |
26 |
29 |
90 |
| native |
22 (63%) |
13 (50%) |
23 (79%) |
58 (64%) |
Table 6: Sensitivity (SE), specificity (SP), positive predictive value
(PPV), negative predictive value (NPV), and accuracy of the evaluation of the native MRIs divided into the groups of no lesion, metastasis, HCC, cyst/hemangioma, and FNH/adenoma.
|
SE (%) |
SP (%) |
PPV (%) |
NPV (%) |
Accuracy (%) |
| No lesion (group 1) |
100 |
96 |
93 |
100 |
98 |
| Metastasis (Group 2) |
100 |
100 |
100 |
100 |
100 |
| HCC (Group 3) |
79 |
100 |
100 |
96 |
96 |
|
Cyst/ hemangioma (group 4)
|
93 |
100 |
100 |
99 |
99 |
| FNH/ Adenoma (Group 5) |
71 |
100 |
100 |
99 |
99 |
Discussion
The aim of this study was to determine whether CM is needed
for imaging liver lesions and for which indications. Patients with
liver lesions were divided into 5 groups. One extra group were
patients without liver lesions.
In the “liver metastasis group” we could not detect any advantage regarding the detection and number of liver metastases
with additional performance of CM sequences. Using our diagnostic criteria with hypointensity in T1w, hyperintensity in T2w,
and diffusion restriction we succeeded in detecting and correctly
assigning all liver metastases of the 61 patients with analysis of
the native sequence only. Our observation is in agreement with
the work of Lavelle et al. [9]. In 2015, they found no advantage of
CM sequence over DWI in the hepatobiliary phase in 22 patients
with liver metastases from neuroendocrine tumours and concluded that DWI is an adequate tool for visualization and assessment
of neuroendocrine metastases in clinical applications. Also, Allam
et al. [10] (2017) found no advantage of CM sequences regarding
the detection of metastases compared to DWI when studying 20
patients (15 with multiple and 5 with isolated liver metastases). In
contrast to our work, Allam et al. included the ADC value in their
evaluation and defined all ADC values below 0.8 x 10¯³ mm² /s as
malignant. The ADC value was not included in our study because
respiratory motion does not always ensure an identical depth of
breath at b50 and b800, and the ADC value, especially in small
lesions, could be calculated incorrectly by consequence. Instead,
we used the lack of signal drop between the low and high b values as a diagnostic criterion. Also, Hwang et al. [11] showed in
their study that native liver MRI can be used as an alternative to
gadoexatic acid-enhanced liver MRI in the detection of liver metastases from colorectal cancer.
Chung et al. [12] reported that it is difficult to distinguish very
small metastases from vessels using CM sequences. In these cases, DWI has the great advantage because it effectively suppresses
the signal from vessels above a b value of 50 [13]. In the present
evaluation, we were able to detect 16 liver metastases with a
size of ≤1.0 cm in 5 patients using DWI. Thus, DWI represents
the crucial sequence for the detection of liver metastases. Also,
good image quality of DWI with complete coverage of the liver
without gaps is important. Therefore, image acquisition should be
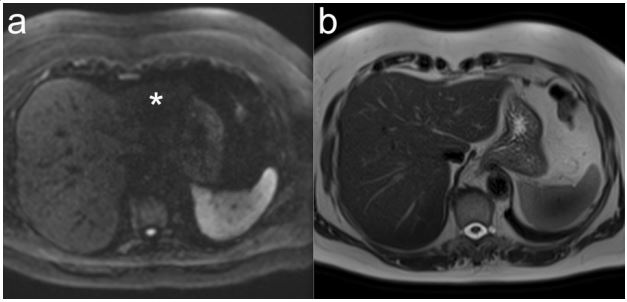
measured in free breathing with breath triggering. One problem,
however, is occasionally the left lobe of the liver, where extinction
phenomena may occur due to proximity to the heart (Figure 2).
This can be overcome by flow-compensated DWI [14].
The perfusion behaviour of liver metastases may give an indication of the primary tumour. Liver metastases, e.g., from lung,
colon, or gastric carcinomas, are often hypovascular in the arterial phase, whereas metastases from NET, renal cell carcinoma,
or thyroid carcinoma are often hypervascular [15]. Consequently,
we could not use the native sequences alone to infer the primary
tumour. Despite this limitation, according to our results, the native sequence is a very good method for the detection of liver
metastases.
After ablation therapy, delineation of the defect and assessment of residual tumour tissue in native technique may be difficult. In the present study, 12 patients with liver metastases had
received ablation therapy. Ablation treatments can lead to periablation edema and signal changes in the high b values (B800), especially in the initial follow-up, after therapy [16]. Therapeutically induced tissue changes (e.g., necrosis, periablation edema,
fibrosis, inflammatory responses) are associated with lower signal intensities compared with tumour tissue in the high b values
and hyperintensity in the ADC map. In contrast, tumour tissue is
hyperintense in high b values and hypointense in ADC. In one patient from our collective, we found 3 metastasis-selective lesions
at one large ablation defect and one metastasis-selective lesion at
another ablation defect due to the high signal in the high b-value
DWI. However, with purely native sequences, it is occasionally difficult to identify the location and size of the ablation defect. In our
study, we could not confidently assign 5 lesions with the native
sequences that could be clearly assigned to ablation defects with
i.v. CM. Therefore, the first follow-up after an ablative procedure
should be performed with i.v. CM.
n the cyst or hemangioma group, 101/106 lesions were diagnosed as cyst or hemangioma in 22/27 patients with native imaging only. The diagnostic criterioin for both entities was a lesion
that was hypo-/isointense in T1w, severely hyperintense in T2w,
and iso-/hyperintense with high b-values [17,18]. Since we had
no discriminator for cyst versus hemangioma with the native sequences, we could not confidently distinguish between the two
entities in any of the patients. In individual cases, it may be difficult to diagnose cyst/hemangioma with certainty using only native
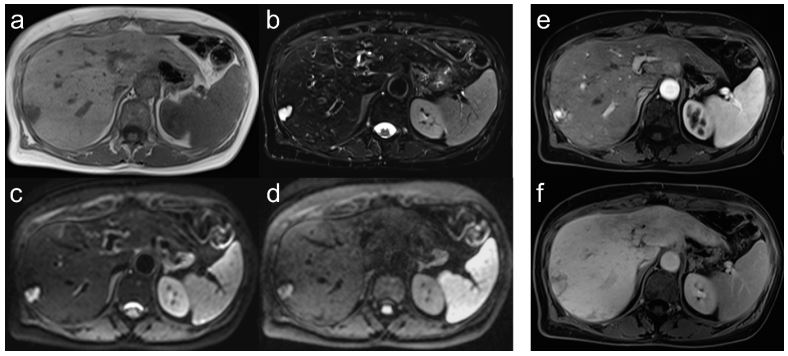
sequences. In our collective, 2 patients (1 cyst/1 hemangioma)
had abnormal lesions detected on MRI that we could not confidently assign to a cyst/hemangioma using only native sequences (Figure 3). Therefore, at least one MRI with i.v. CM should be
performed in every patient to exclude malignant liver lesions or
to further clarify suspicious liver lesions in other imaging modalities. In individual cases, differentiation between cystic metastases
and simple cysts may be difficult. After evaluation of our data, all
metastases were correctly identified, so no cystic metastasis was
misclassified as a simple cyst. Fifteen of 16 cysts in our collective
were homogeneous in T1 and T2 weighting and without fluid-fluid
levels, which is why they were classified as cysts. The two relevant
factors for differentiation are a strong hyperintense signal behaviour of the cyst in T2w and DWI with low b value and a decreasing signal in DWI with high b value. In contrast, metastases are
diffusion impaired with hypointensity in ADC and strong signal in
DWI at high b values. Vaccha et al. [19] described simple cysts
as homogeneous in T1w and T2w. In contrast, cystic metastases
had wall irregularities, wall thickening, septation, hemorrhage or
contrast enhancement, and diffusion defects, as well as a stratification phenomenon as diagnostic criteria.
In the HCC group, 48 of 90 lesions were diagnosed as HCC in 27
of 42 patients with native imaging only. The diagnostic criterion
was an iso-/hyperintense lesion in T1w with diffusion abnormality in patients with liver cirrhosis [20,21]. Also, Gluskin et al. [22]
reported in 2015 that in HCC patients in whom contrast administration was not possible, DWI can be very helpful in detecting
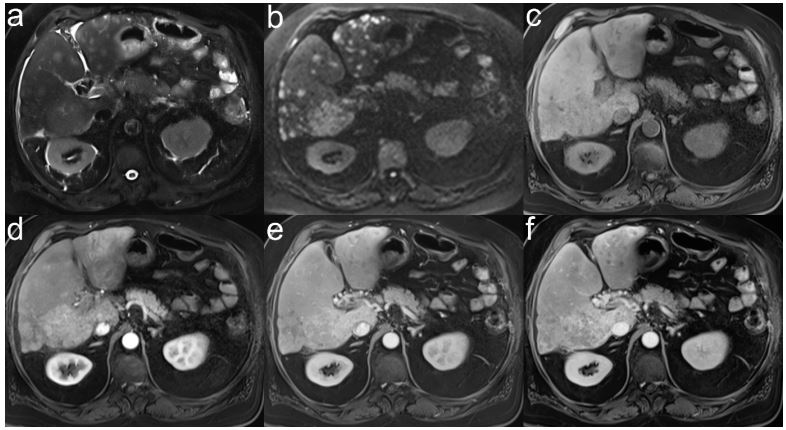
HCC lesions. In our study, 2 patients with HCC had very weak CM
enhancement and were not reliably detected as HCC without DWI
(Figure 4). In 3 patients with HCC, lesions with diffusion restriction without CM uptake were found in the arterial phase. Only
during follow-up all of these lesions showed CM uptake. DWI was
more sensitive than CM sequences in these cases and one should
consider including DWI in the LI-RADS criteria [8]. Interestingly, the detection rate of HCC foci with high LI-RADS classification was
not better than with low LI-RADS classification. In summary, our
results show that CM sequences are necessary for reliable detection of HCC lesions, but DWI can be helpful in individual cases. In
a study of 50 HCC patients treated by radioembolization, DWI also
showed in isolated cases an advantage over Gd-EOB-DTPA MRI
with respect to therapy evaluation [23].
In our collective, 5/240 patients had FNH and 2/240 patients
had liver adenoma. Our diagnostic criteria for FNH were according
to Bieze et al. [24] a hypo-/isointense lesion in T1w, a hyperintense central scar in T2w, and an iso-/mildly hyperintense lesion
in DWI/ADC, and for a liver adenoma according to Ronot et al.
[25] an iso-/hyperintense lesion in T1w with a signal drop in the
opposed phase, due to fat content, which is slightly hyperintense
to the surrounding liver tissue in T2w and in DWI. Using these diagnostic criteria, we were able to correctly match 3 of 5 patients
with one FNH lesion each and 1/2 patients with ≥5 liver adenomas each using native imaging only. After the 2nd native analysis,
we were also able to correctly group the other patient with liver
adenomas using the preliminary images. The remaining 2/5 patients with FNH did not show hyperintense central scar in T2w,
thus their correct assignment was not possible. With a sensitivity
of 71%, native MRI is thus not suitable to detect liver adenoma or
FNH. Assignment of these entities is often only possible with MRI
using liver-specific contrast agents [17] and is important, as liver
adenomas can malignantly degenerate and/or hemorrhage in the
liver [26,27].
In 36 of 240 patients, 54 lesions were found in native technique
that could not be assigned to groups 1 to 5 using our criteria. After
a 2nd analysis with the aid of the previous findings, the previous
images, and the electronic medical record, this was successful in
16 of 36 patients (HCC (n=6), hemangioma (n=3), adenoma (n=1),
CCC (n=4), NEC of the gallbladder (n=1), and epithelioid hemangioendothelioma (n=1)).
The remaining 20 patients could not be further classified.
These were patients with an HCC (n=3), cyst (n=1), hemangioma
(n=1), FNH (n=2), CCC (n=1), ablation defect (n=5), and angiosarcoma (n=1). Six patients had a lesion that could not be confidently
assigned to an entity, even with the use of contrast sequences, or
histologic confirmation was not performed. The lesions in these
20 patients can be divided into two groups. First, lesions that can
be detected better with CM than with the native sequences including DWI. These include ablation defects (n=5), CCC (n=1), and
atypical cyst with less signal in T2w (n=1). On the other hand, lesions showing particular CM dynamics such as hemangioma (n=1)
and HCC (n=3).
Limitations
The current study is subject to certain limitations. The small
number of lesions (n=498), especially the small number of FNHs
and adenomas, and the retrospective study design might have influenced the statistical results. Our result with a sensitivity and
specificity of 100% of native sequences for metastases would
probably be slightly worse with a larger number of metastases
(n=268). Nevertheless, DWI has a very good sensitivity for liver
metastases, which cannot be improved by non-liver specific contrast medias. In a few other studies [28,29], sensitivity for metastases was slightly increased with liver-specific contrast agents.
MRI findings with i.v. CM and native sequences including DWI
were chosen as the reference standard. Histopathologic findings
of the lesions were available only in isolated cases, whereas an
incorrect classification of the lesions in the reference standard
should be negligible. At our institute, DWI has a high value for
the detection of liver metastases. It is possible that even in the
reference standard, the DWI images were the main ones used for
diagnosis, while all other sequences, especially those after CM administration, played a minor role.
Conclusion
In our study, liver MRI with exclusively native sequences was
only convincing in the detection of liver metastases. In future,
contrast media could be omitted for examinations to follow-up
known liver metastases or for the first follow-up examination after an ablative procedure. Even the reliable exclusion of metastases, e.g., preoperatively, would be possible using the native
technique. However, this requires a DWI with good image quality.
In all other entities, the administration of i.v. contrast media is
mandatory at present.
Declarations
Note: The present work has been carried out in (partial) fulfilment of the requirements for the award of the degree of Dr. med.
Conflicts of interest: Authors declare no conflict of interest.
References
- Ai L, Chen J, Yan H, He Q, Luo P, Xu Z, et al. Research Status and Outlook of PD-1/PD-L1 Inhibitors for Cancer Therapy. Drug Des Dever Thel. 2020; 14: 3625-3649.
- Inokuchi J, Eto M. Profile of pembrolizumab in the treatment of patients with unresectable or metastatic urothelial carcinoma. Cancer Manag Res. 2019; 11: 4519-4528.
- Sheppard K, Fitz L, Lee J, Benander Ch, George J, Wooters J, et al. PD-1 inhibits T-cell receptor induced phosphorylation of the ZAP70/CD3ζ signalosome and downstream signaling to PKCθ. FEBS Letters. 2004.
- Karwacz K, Bricogne C, MacDonald D, Arce F, Bennett CL, Collins M, et al. Pd-L1 co-stimulation contributes to ligand-induced T cell receptor down-modulation on CD8+ T cells. EMBO Mol Med. 2011; 3: 581-592.
- Clark C, Gupta H, Sareddy G, Pandeswara S, Lao S, Yuan S, et al. Tumor-Intrinsic PD-L1 Signals Regulate Cell Growth, Pathogenesis, and Autophagy in Ovarian Cancer and Melanoma. Cancer Res.. 2016; 76(23): 6964-6974.
- Azuma T, Yao S, Zhu G, Flies A, Flies S, Chen L. B7-H1 is a ubiquitous antiapoptotic receptor on cancer cells. Blood. 2008; 111(7): 3635-3643.
- Gato-Cañas M, Zuazo M, Arasanz H, Breckpot K, Kochan G, Escors D. PDL1 Signals through Conserved Sequence Motifs to Overcome Interferon-Mediated Cytotoxicity. Cells Reports. 2017; 20(8): p1818-1829.
- Hodi F, O’Day S, McDermontt D, Weber R, Sosman J, Haanen J, et al. Improved Survival with Ipilimumab in Patients with Metastatic Melanoma. N Engl J Med. 2010; 363: 711-723.
- Larkin J, Chiarion-Sileni V, Gonzalez R, Grob JJ, Rutkowski P, Lao Ch, et al. Five-Year Survival with Combined Nivolumab an Ipilimumab in Advanced Melanoma. N Engl J Med. 2019; 381: 1535-1546.
- Champiat S, Lambotte O, Barreau E, Belkhir R, Berdelou A, Carbonnel F, et al. Management of immune chekpoint blockade dysimmune toxicities: a collaborative position paper. Ann Oncol. 2016; 27(4): 559-574.
- Eggermont A, Kicinski M, Blank Ch, Mandala M, Long G, Atkinson V, et al. Five-Year Analysis of Adjuvant Pembrolizumab or Placebo in Stage III Melanoma. NEJM Evid. 2022; 1(11).
- Luke J, Rutkowski P, Queirolo P, Del Vecchio M, Mackiewicz J, Chiarion-Sileni V, et al. Pembrolizumab versus placebo as adjuvant therapy in completely resected IIB or IIC melanoma (KEYNOTE-716): a randomised, double-blind, phase 3 trial. Lancet. 2022; 399(10336); p1718-1729.
- Felip E, Altorki N, Zhou C, Csószi T, Vynnychenko I, Goloborodko O, et al. Adjuvant atezolizumab after adjuvant chemotherapy in resected stage IB-IIIA non-small-cell lung cancer (Impower010): a randomised, multicentre, open-label, phase 3 trial. Lancet. 2021; 398(10308): 1344-1357.
- Kelly R, Ajani J, Kuzdzal J, Zander Th, Van Cutsem E, Piessen G, et al. Adjuvant Nivolumab in Resected Esophageal or Gastroesophageal Junction Cancer. N Engl J Med. 2021; 384: 1191-1203.
- Schmid P, Cortes J, Pusztai L, McArthur H, Kammel S, Bergh J, et al. Pembrolizumab for Early Triple-Negative Breast Cancer. N Engl J Med. 2020; 382: 810-821.
- Forde P, Spicer J, Lu S, Provencio M, Mitsudomi T, Awad M, et al. Neoadjuvant Nivolumab plus Chemotherapy in Resectable Lung Cancer. N Engl J Med. 2022; 386: 1973-1985.
- Michot J, Bigenwald C, Champiat S, Collins M, Carbonnel F, PostelVinay S, et al. Immune-related adverse events with immune checkpoint blockade: a comprehensive review. Eur J Cancer. 2016; 54: 139-148.
- Becker A, Hickmann D, Hansen J, Meyer C, Rink M, Schmid M, et al. Critical analysis of a simplified Fuhrman grading scheme for prediction of cancer specific mortality in patients with clear cell renal cell carcinoma- - Impact on prognosis. Eur J Surg Oncol. 2016; 42(3): 419-425.
- Swami U, Nussenzveig R, Haaland B, Agarwai N. Revisiting AJCC TNM staging for renal cell carcinoma: quest for improvement. Ann Transl Med. 2019; 7(Suppl 1): S18.
- Powles Th, Tomczak P, Park S, Venugopal B, Ferguson Th, Symeonides S, et al. Pembrolizumab versus placebo as post-nephrectomy adjuvant therapy for clear cell renal cell carcinoma (KEYNOTE-564): 30-month follow-up analysis of a multicentre, randomised, doubleblind, placebo-controlled, phase 3 trial. Lancet Oncol. 2022; 23(9). 1133-1144.
- Brahmer J, Lacchetti Ch, Schneider B, Atkins M, Brassil K, Caterino J, et al. Management of Immune-Related Adverse Events in Patients Treated with Immune Checkpoint Inhibitor Therapy: American Society of Clinical Oncology Clinical Practice Guideline. J Clin Oncol. 2018; 36(17): 1714—1768.
- Catalano M, Roviello G, Galli Ll, Santi R, Nesi G. Immune checkpoint inhibitor induced nephrotoxicity: An ongoing challenge. Front Med (Lausanne). 2022; 9: 1014257.
- Bernard-Tessier A, Jeanville P, Champiat S, Lazarovici J, Voisin A-L, Mateus C, et al. Immune-related eosinophilia induced by antiprogrammed death 1 or death-ligand 1 antibodies. EJC. 2017; 81: p135-137.
- Naranjo CA, Bustos U, Sellers EM, Sandor P, Ruíz I, Roberts EA, et al. A method for estimating the probability of adverse drug reactions. Clin Pharmacol Ther. 1981; 30(2): 239-245. doi: 10.1038/clpt.1981.154.
- Schiappacasse G. Monocular Tunnel Vision Produced by Oxaliplatin. J Oncology. 2023; 3(2): 1094.
- Scanvion Q, Béné J, Gautier S, Grandvuillemin A, Le Beller Ch, Chenaf Ch, et al. Moderate-to-severe eosinophilia induced by treatment with immune checkpoint inhibitors: 37 cases from a national reference center for hypereosinophilic syndromes and the French pharmacovigilance database. OncoImmunology 2020; 9:1.
- Hude I, Sasse S, Bröckelmann P, Von Tresckow B, Momotow J, Engert A, et al. Leucocyte and eosinophil counts predict progressionfree survival in relapsed or refractory classical Hodgkin Lymphoma patients treated with PD1 inhibition. Br J Haematol. 2018; 181(6): 837-840.
- Weide B, Martens A, Hassel J, Berking C, Postow M, Bisschop k, et al. Baseline Biomarkers for Outcome of Melanoma Patients Treated with Pembrolizumab. Clin Cancer Res. 2016; 22: 5487-5496.
- Gaba L, Victoria I, Pineda E, Fernández A, Aya F, Prat A, et al. Changes in blood eosinophilia during anti-PD1 therapy as a predictor of long term disease control in metastatic melanoma. J Clin Oncol. 2015; 33(15_suppl): 9096.
- Haanen J, Carbonnel F, Robert C, Kerr KM, Peters S, Larkin J, et al. Management of toxicities from immunotherapy: ESMO Clinical Practice Guidelines for diagnosis, treatment, and follow-up. Ann Oncol. 2017; 28: iv119–142.
- Thompson JA, Schneider BJ, Brahmer J, Andrews S, Armand P, Bhatia S, et al. Management of immunotherapy-related toxicities, version 1.2019. JNCCN J Natl Comprehen Cancer Netw. 2019; 17: 255–289.
- Simon S, Utikal J, Umansky V. Opposing roles of eosinophils in cancer. Cancer Immunol. Immunother. 2019; 68: 823-833.
- Carretero R, Sektioglu IM, Garbi N, Salgado OC, Beckhove P, Hämmerling GJ. Eosinophils orchestrate cancer rejection by normalizing tumor vessels and enhancing infiltration of CD8+ T cells. Nat Immunol. 2015; 16(6): 609-617.
- Gupta S, Short S, Sise M, Prosek J, Madhavan S, Soler M, et al. Acute kidney injury in patients treated with immune checkpoint inhibitors. Immunother Cancer. 2021; 9(10): e003467.
- Gupta S, García-Carro C, Prosek J, Glezerman I, Herrmann S, García P, et al. Shorter versus longer corticosteroid duration and recurrent immune checkpoint inhibitor-associated AKI. Immunother Cancer. 2022; 10(9): e005646.
- Maxwell R, Luksik A, Garzon-Mudvi T, Hung AL, Kim E, Wu A, et al. Contrasting impact of corticosteroids on anti PD-1 immunotherapy efficacy for tumor histologies located within or outside the central nervous system. Oncoimmunology. 2018; 7: 12.
- Kuhn Th. The Structure of Scientific Revolutions. Ed University of Chicago Press. 2012.