Introduction
Traditionally, it is believed that cancer is caused by genetic alterations including deletions, mutations, genomic instability, Copy Number Variations (CNVs), insertions, recombination, and single-nucleotide polymorphisms [1]. However, increasing evidence suggests that cancer occurrence, development and progression are results of the interaction of genetic and epigenetic changes [2,3]. Recent evidence has shown that half of tumour suppressor gene inactivation is the result of epigenetic rather than genetic mechanisms [4].
DNA methylation is the most common epigenetic regulatory mechanism and plays a critical role in parental imprinting, DNA replication, regulation of gene expression, X chromosome inactivation, and stable gene silencing [1,5,6]. The levels and patterns of DNA methylation are regulated by both DNA methyltransferase (DNMT, including DNMT1, DNMT3A and DNMT3B) and the Ten-Eleven-Translocation (TET) family of dioxygenases (TET1, TET2 and TET3) [7-10]. DNMTs are responsible for transferring a methyl group to the fifth carbon of a cytosine residue to form 5-methylcytosine (5mC) and mediate active DNA methylation [11]. In contrast, TET family oxidizes 5mC to form 5-hydroxymethylcytosine (5hmC), 5-formylcytosine (5fC), and 5-carboxylcytosine (5caC), thereby regulating active DNA demethylation [11,12]. DNA methylation and demethylation are processes of dynamic regulation and mutual transformation mediated by changes in DNMT/TET activity, which are critical in tumorigenesis and development [13-16]. reported that DNMT down-regulated the expression level of Barx2, thereby promoting the proliferation and invasion of gastric cancer cells [16]. Su Jung et al. demonstrated that miR-22 could inhibit demethylation of miR-200 through direct targeting of the TET family of methylcytosine dioxygenases, thereby exerting breast cancer metastatic potential [17]. In recent years, the development of high-throughput sequencing has led to a drastic increase in genetic and epigenetic research in diverse cancers. Numerous mutations in DNMT and TET have been identified in carcinogenic processes, highlighting the importance of DNA methylation mechanisms in the occurrence, development and prognosis of human cancer. However, the specific implication concerning DNMT/TET genes in tumorigenesis has not been fully elucidated.
Given the role of DNA methylation in cancer, it is of great interest to elucidate the whole landscape of expression, mutation, and copy number variation of DNMT/TET genes, as well as their oncogenic pathway activity, immune cell infiltration and prognostic potential. This study was designed to analyse DNMT/TET gene data from 33 types of cancers in The Cancer Genome Atlas (TCGA). We postulate that this work will generate fresh insight into the way DNMT/TET genes influence cancer.
Materials and methods
Collection of DNMT/TET genes
We collected six key DNMT family members (DNMT1, TRDMT1, DNMT3A, DNMT3B, DNMT3L, DMAP1) and three key TET family members (TET1, TET2, TET3) from published review papers [18-20]. We manually converted the gene symbols into Human Genome Organisation Gene Nomenclature Committee (HGNC) symbols and Ensemble gene IDs from GeneCards. (https://www.genecards.org/).
Pan-cancer genome-wide omics data and tumour types
We obtained omics datasets from TCGA database (http://cancergenome.nih.gov/) aimed at TPM (transcripts per kilobase million) expression, mutation, CNVs, methylation data and clinical information (survival status, survival time) from 33 different types of cancers, including CHOL: cholangiocarcinoma; KIRC: kidney renal clear cell carcinoma; DLBC: lymphoid neoplasm diffuse large b-cell lymphoma; KIRP: kidney renal papillary cell carcinoma; UVM: uveal melanoma; KICH: kidney chromophobe; MESO: mesothelioma; LGG: brain lower grade glioma; THYM: thymoma; GBM: glioblastoma multiforme; TGCT: testicular germ cell tumors; BRCA: breast cancer; ESCA: esophageal carcinoma; LUSC: lung squamous cell carcinoma; PAAD: pancreatic adenocarcinoma; LUAD: lung adenocarcinoma; READ: rectum adenocarcinoma; LAML: acute myeloid leukemia; COAD: colon adenocarcinoma; SARC: sarcoma; UCS: uterine carcinosarcoma; PCPG: pheochromocytoma and paraganglioma; UCEC: uterine corpus endometrial carcinoma; ACC: adrenocortical carcinoma; OV: ovarian serous cystadenocarcinoma; CESC: cervical squamous cell carcinoma and endocervical adenocarcinoma; HNSC: head and neck squamous carcinoma; LIHC: liver hepatocellular carcinoma; THCA: thyroid carcinoma; BLCA: bladder urothelial carcinoma; PRAD: prostate adenocarcinoma; SKCM: skin cutaneous melanoma; STAD: stomach adenocarcinoma. All of the TCGA data were downloaded via UCSC XENA (https://xenabrowser.net/).
mRNA differential expression analysis in pan-cancer
mRNA Seq data were collected from TCGA database. Only 17 cancer types with more than three pairs of tumour and normal samples were included in the analysis, including BLCA, BRCA, CHOL, COAD, ESCA, HNSC, KICH, KIRC, KIRP, LIHC, LUAD, LUSC, PRAD, READ, STAD, THCA and UCEC. The mRNA values were expressed as normalized RSEM values. The genes with |Log2 fold change| > 1 and adjusted P values < 0.05 were reserved for further analysis. TBtools software was used to draw a heatmap [21].
Protein-wide omics data across 20 cancer types from protein expression data
Protein expression data were derived from Human Protein Atlas Datasets (HPA)(https://www.proteinatlas.org/). In the HPA database, the protein expression of each gene was divided into four groups, high, medium, low and not detected, among which one group with a sample number < 3 was not included in the subsequent analysis. DNMT/TET protein expression was systematically analysed in 20 cancer types, including SKCA, BRCA, ENCA, RACA, STCA, PACA, carcinoid, OV, URCA, LIHC, CECA, THCA, melanoma, PRCA, COCA, lymphoma, TECA, glioma, LUCA, HNSC. The results were visualized by GraphPad Prism version 8 (GraphPad Software, La Jolla, CA, USA).
Genome-wide mutation analysis and CNV analysis
Raw data on DNMT/TET gene mutations and CNVs across 33 cancer types were obtained from the TCGA database. The mutation frequency was calculated. In the CNV module analysis, the CNV data were divided into two groups, amplification and deletion, and processed using GISTICS 2.0. The percentage of CNVs and the correlation of raw CNV data and mRNA RSEM data were calculated. The P-value was adjusted by the FDR.
Oncogenic pathway activity analysis
The correlation between gene expression and cancer-related pathways was determined using Gene Set Variation Analysis (GSVA). This is a Gene Set Enrichment (GSE) method to estimate pathway activity variation based on a sample expression matrix in an unsupervised, non-parametric manner. The Spearman Correlation Coefficient (SCC) was calculated to assess the correlation between gene expression and pathway activity. |SCC| > 0.25 and adjusted P value < 0.05 were considered to indicate a significant correlation. The results were visualized by Cytoscape v3.7.1.
Immune cell infiltration analysis
The major immune cell-related genes are shown in Supplementary Table 1. We calculated the SCC between the expression of DNMT/TET genes and immune-related genes to explore their association. |SCC| > 0.25 and adjusted P value < 0.05 were considered to indicate a significant correlation. The results were visualized by Cytoscape v3.7.1.
DNA methylation and KEGG analysis
The LinkedOmics database (http://www.linkedomics.org.) was used to identify DNMT3B-related methylation genes in cancers, including BLCA, BRCA, COAD/READ, ESCA, STAD, HNSC, KIRP, LIHC, LUAD, LUSC and UCEC. The correlation between the expression of DNMT3B and the methylation level of genes was considered to be statistically significant with |SCC| > 0.3 and adjusted P value < 0.05. Next, to investigate the anomalous pathways by dysregulated DNMT3B-related methylated genes in cancers, enrichment analysis of Kyoto Encyclopedia of Genes and Genomes (KEGG) pathways was conducted using the clusterProfiler R package [22]. P < 0.05 was considered to be statistically significant.
Survival analysis
DNMT/TET gene mRNA expression data and corresponding clinical survival data in pan-cancer were merged for survival analysis. The median gene expression was selected as a cut-off value to divide tumour samples into high and low groups. Kaplan-Meier analysis with the log-rank test was used to compare survival rates between the two groups. Additionally, gene expression and prognostic value associations were analysed using the GEPIA2 (Gene Expression Profiling Interactive Analysis 2) database. A P value < 0.05 was considered as statistically significant.
Statistical analysis
All statistical analyses were performed using R software v4.1.0 (http://www.r-project.org) and GraphPad Prism version 8 (GraphPad Software, La Jolla, CA, USA). Spearman correlation test was used for correlation analysis. If not otherwise stated, the rank-sum test was used to test two sets of data, and a P value < 0.05 was considered statistically significant.
Results
DNMT/TET gene expression profiles in pan-cancer
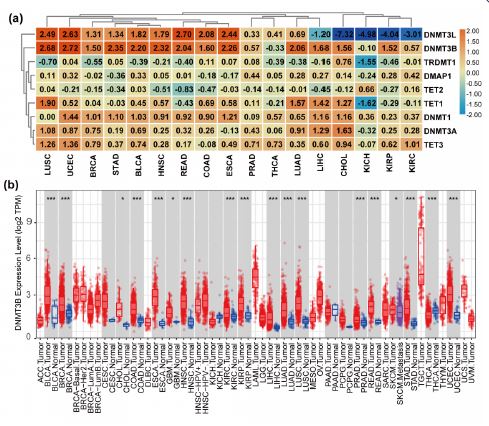
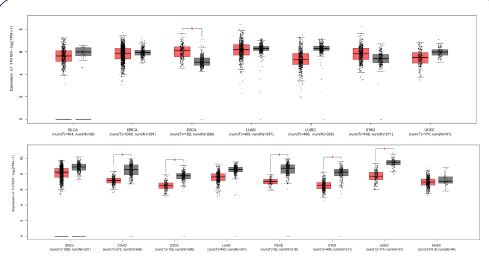
We summarized the chromosomal positions of all DNMT/TET family members across the published literature (Table 1). We then analysed the gene expression differences in TCGA. The reresults showed heterogeneous expression of DNTM and TET genes in different cancer types. DNMT3B was highly expressed in 13 of the 17 tumours analysed; DNMT3L was expressed at low levels in CHOL, KICH, KIRP, and KIRC and had increased expression in UCEC READ, ESCA, and LUSC. (Figure 1a). The log2FC and adjusted P value of the results are listed in Table 2. The differential expression of DNMT3B in different cancers is visualized (Figure 1b). DNMT3B expression is up-regulated in many cancer types, including BLCA, BRCA, CESC, CHOL, COAD, ESCA, GBM, HNSC, KIRC, KIRP, LIHC, LUAD, LUSC, PRAD, READ, STAD and UCEC.
Table 1: Basic characteristics of DNMT/TET genes.
| HGNC ID(gene) |
GENE ID |
Approvedsymbol |
Synonym(s) |
Exon |
Chromosomallocation |
| 2976 |
1786 |
DNMT1 |
AIM |
41 |
19p13.2 |
| DNMT |
| MCMT |
| CXXC9 |
| HSN1E |
| ADCADN |
| m.HsaI |
| 2977 |
1787 |
TRDMT1 |
DMNT2 |
15 |
10p13 |
| DNMT2 |
| PUMET |
| RNMT1 |
| MHSAIIP |
| 2978 |
1788 |
DNMT3A |
TBRS |
34 |
2p23.3 |
| HESJAS |
| DNMT3A2 |
| M.HsaIIIA |
| 2979 |
1789 |
DNMT3B |
ICF |
24 |
20q11.21 |
| ICF1 |
| M.HsaIIIB |
| 2980 |
29947 |
DNMT3L |
- |
12 |
21q22.3 |
| 18291 |
55929 |
DMAP1 |
EAF2 |
11 |
1p34.1 |
| SWC4 |
| MEAF2 |
| DNMAP1 |
| DNMTAP1 |
| 29484 |
80312 |
TET1 |
LCX |
20 |
10q21.3 |
| CXXC6 |
| bA119F7.1 |
| 25941 |
54790 |
TET2 |
MDS |
15 |
4q24 |
| KIAA1546 |
| 28313 |
200424 |
TET3 |
BEFAHRS |
17 |
2p13.1 |
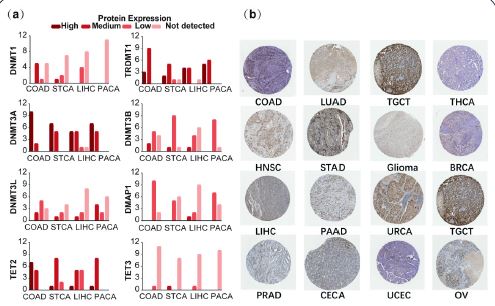
Furthermore, we analysed DNMT/TET protein expression levels in different cancer types. In COAD, STAD, LIHC and PAAD, DNMT3A, TRDMT1, and TET2 were highly expressed, while TET3 expression was significantly reduced (Figure 2a). Detailed DNMT/TET protein expression information in 20 cancers is shown in Supplementary Table 3. DNMT3B protein expression in different human cancers is shown in Figure 2b.
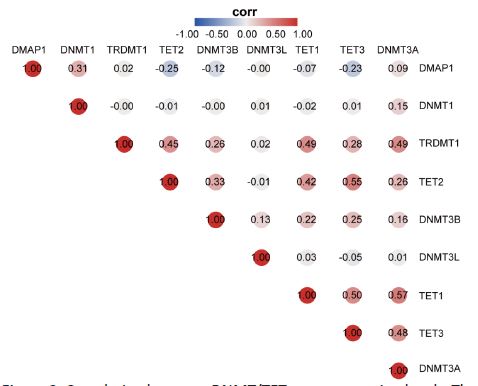
Additionally, we elucidated the correlations between DNMT and TET gene expression in pan-cancer. Significant correlations were identified between DNMT3A and TET1 (r=0.57, p< 0.05), TET2 and TET3 (r=0.55, p< 0.05), and TET1 and TET3 (r=0.50, p< 0.05) (Figure 3).
DNMT/TET genetic alterations in pan-cancer
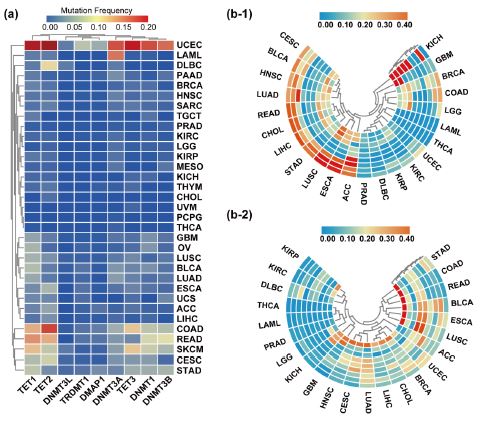
We examined the DNMT/TET gene mutation frequency in 33 cancer types. Frequent mutations were observed in UCEC, including TET1, TET2, TET3, DNMT1, DNMT3A, and DNMT3B, and rare mutations were observed in CHOL, PCPG, and THCA. TET1 and TET2 had higher mutation frequencies than other genes in pan-cancer, and the overall average mutation frequency of DNMT/TET genes in different cancer types ranged from 0 to 34.9% (Figure 4a). We also investigated DNMT/TET gene CNVs across cancers (Figure 4b). DNMT3B exhibited inclusive copy number amplification in STAD, COAD, READ, BLCA, ESCA, and LUSC, but almost no copy number deletions in multiple cancer types. Most DNMT/TET genes displayed copy number deletions in BLCA, ESCA, LUSC and LUAD but copy number variations were rarely observed in LIHC and LAML.
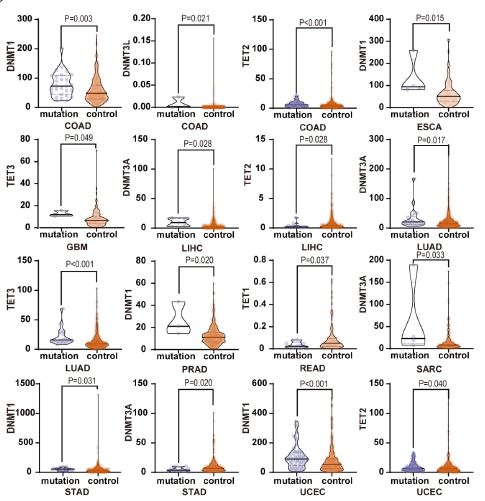
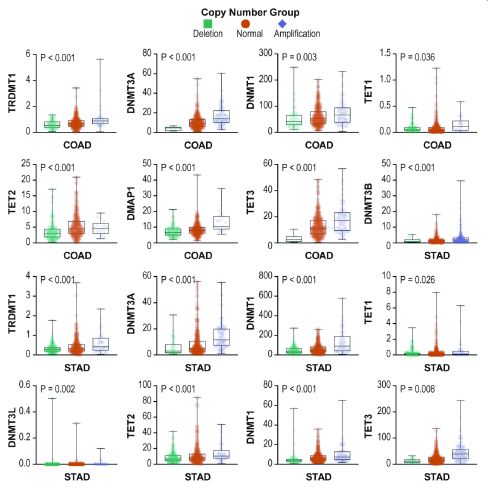
Next, we analysed the relationship between DNMT/TET gene mutations and expression levels in human cancers and visualized the statistically significant results (Figure 5). Correlation analysis revealed that the expression of genes was positively associated with mutations, especially DNMT1 in COAD, ESCA, STAD, UCEC, and PRAD; DNMT3A in LIHC, LUAD and SARC; and DNMT3L and TET2 in COAD. However, DNMT3A in STAD and TET1 in READ showed a negative correlation. The details are shown in Table 4. The associations between CNVs and mRNA expression in multiple cancer types are shown in Figure 6. We found that almost all expression changes in DNMT/TET genes were associated with CNVs.
Correlation between DNMT/TET genes and cancer-related pathways
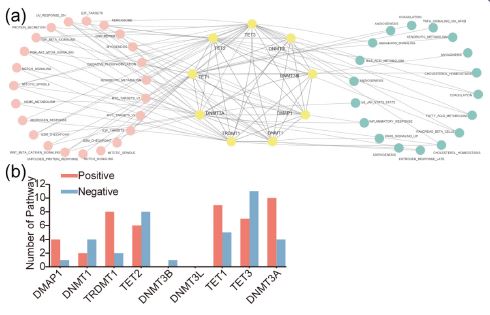
We investigated the correlation between DNMT/TET gene expression and cancer-related pathways to clarify the molecular significance of DNMT/TET genes in carcinogenesis. DNMT/TET genes were significantly correlated with multiple carcinogenesis pathways, playing both activation and suppression roles (Figure 7a). We concluded that DNMT/TET genes were mainly involved in the following cancer-related pathways: UV response DN, mitotic spindle, cholesterol homeostasis, TGF beta signaling, xenobiotic metabolism, G2/M checkpoint, and E2F targets (Table 5). We also found that DNMT3A, TET1, TET2, and TET3 were more likely to be related to tumour occurrence and progression pathways (Figure 7b).
Correlation between DNMT/TET genes and immune cell infiltration
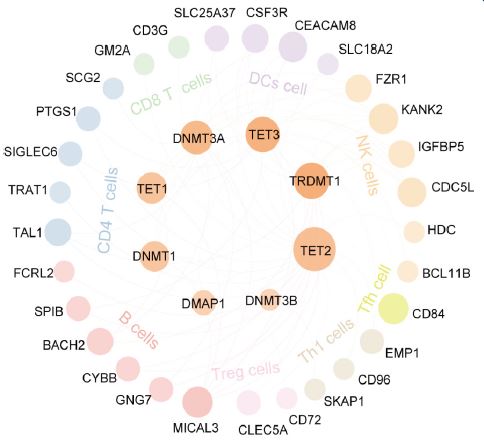
The correlation between DNMT/TET gene expression and immune cell infiltration across cancers was assessed. DNMT/TET genes were significantly correlated with NK cells, CD4+T cells, and Tfh cells. Notably, the correlation between DNMT/TET genes and immune cell infiltration tended to be positive. In particular, TET2, TRDMT1, and TET3 showed a stronger correlation (Figure 8).
Identification and KEGG analysis of DNMT3B-related methylated genes
We identified DNMT3B-related methylated genes in BLCA, BRCA, CHOL, COAD/READ, ESCA, STAD, HNSC, KIRP, LIHC, LUAD, LUSC and UCEC (Table 6). Then, we manually retained genes with protein-coding functions in the results. The online Venn diagram tool was used to identify the shared DNMT3B-related methylated genes. TRIM8 and CIRBP were found to be common in 58% cancers. The expression of TRIM8 and CIRBP in these cancers and their para-carcinoma tissue are shown in Figure 9. Compared with normal tissues, TRIM8 was highly expressed in ESCA, while CIRBP was significantly expressed at lower levels in COADREAD, ESCA, STAD and UCEC. To further understand the pathways involved in these methylation genes, KEGG analysis was performed. We found that Salmonella infection, bacterial invasion of epithelial cells and the MAPK signalling pathway were involved in 42% of cancers (Table 7). The MAPK signalling pathway is involved in 5 out of the 12 cancers we analysed, including BRCA, KIRP, LUAD, LUSC and STAD.
Prognostic analysis of DNMT/TET genes in pan-cancer
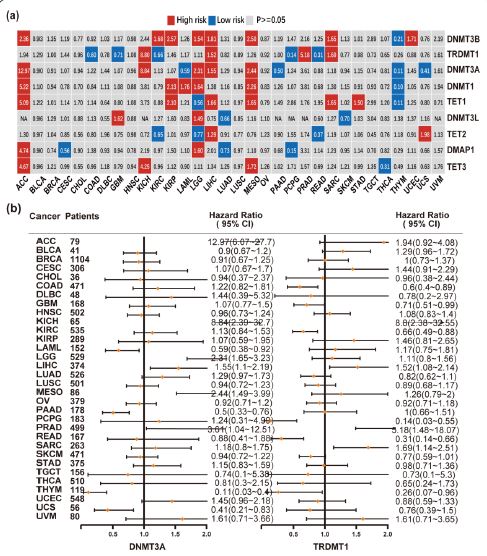
The association between DNMT/TET gene expression and prognosis in patients with different cancers is shown in Figure 10a. DNMT3B, which showed increased expression in ACC, KIRC, KIRP, LGG, LIHC, MESO, SARC, and UCEC; TRDMT1 in KICH, LIHC and PRAD; DNMT3A in ACC, KICH, LIHC,PRAD and SARC; DNMT1 in ACC, KIRP, LAML, LGG and MESO; TET1 in ACC, KIRP, LIHC, MESO, SARC and STAD; DNMT3L in GBM and LGG; TET2 in LIHC and UCS; DMAP1 in ACC and LGG; and TET3 in ACC, KICH and MESO were associated with poor survival. The following genes with decreased expression were associated with poor survival: DNMT1, DNMT3A, DNMT3B and TET1 in THYM; TRDMT1 and TET2 in READ and KICH; TRDMT1 and DMAP1 in PCPG; DNMT3L and DMAT1 in LUAD; TET1 and TET2 in LGG; DNMT3A in UCS, PAAD and LAML; TET3 in THCA; DNMT3L in SKCM; TRDMT1 in GBM and COAD; and DMAP1 in CESC.
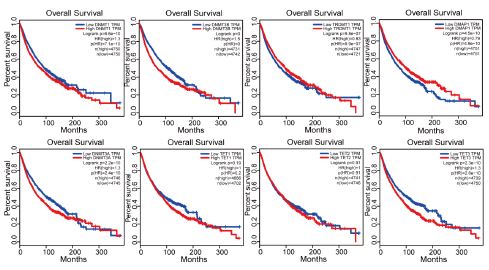
TRDMT1 and DNMT3A had clearly different effects on prognosis in various cancer types (Figure 10b). TRDMT1 was a predictor of poor prognosis in ACC, KICH, LIHC, PRAD, and SARC but not in COAD, GBM, KIRC, PCPG, and READ. Meanwhile, DNMT3A expression was associated with poor prognosis in ACC, KICH, LGG, LIHC, and MESO but not in LAML, PAAD, THYM, and UCS. Moreover, high or low DNMT gene expression was significantly related to patient survival status (Figure 11). Increased DNMT gene expression, except that of DMAP1, was associated with worse prognoses across cancers. Compared to other genes, DNMT3B had the worst prognosis in cancer patients. No significant correlation was observed between the expression level of TET1 or TET2 and overall cancer survival. These results showed that dysregulated DNA methylation might be related to tumorigenesis.
Discussion
To illustrate the pivotal role of the DNA methylation regulatory gene family in cancer, we performed this thorough pan-cancer analysis of the core genes belonging to the DNMT and TET families using data obtained from TCGA, genomic and transcriptomic landscapes. The results suggested that the expression of DNMT/TET was heterogeneous in certain cancers and para-cancer tissues and affected patient prognosis. The identified correlation between DNMT/TET and immune cell infiltration, as well as cancer-related pathways, highlighted the significance of DNMT/TET genes in tumorigenesis.
Our systematic analysis of TPM data of nine key DNMT/TET genes from TCGA database provided an overview of DNMT/TET gene expression profiles in 33 human cancer types. DNMT/TET gene expression in different cancer types was heterogeneous, and DNMT3B was expressed in most cancer types. A review of the available literature supports our results, showing that the expression of DNMT genes is increased in a host of malignant tumours, including PRCA, leukaemia, BRCA, PACA, and COAD [23]. Additionally, TET gene expression is substantially decreased in BRCA, LIHC, LUAD, PACA, and PRCA [24]. DNMT3B expression was increased in BRCA [25], PRCA [26], and COAD [27]. We found that DNMT3L expression levels were increased in COAD, READ, and LUCA and decreased in CHOL, PRAD, and BLCA. These results are consistent with those showing that DNMT3L is highly expressed in LUAD [28] and gastrointestinal stromal tumour [29]. Notably, our findings show that overexpression of DNMT3B and DNMT3L may have important impacts on numerous cancers. The underlying mechanisms of DNMT3B and DNMT3L in cancer deserve further investigation and may provide new ideas for cancer treatment.
DNMT or TET gene mutations may be responsible for the occurrence and progression of tumours [30,31]. By analysing DNMT/TET gene mutations in multiple cancers, we found that the total average mutation frequency ranged from 0 to 34.9% and that TET1 and TET2 had relatively high mutation frequencies in pan-cancer. TET genes are frequently mutated in various cancers. TET gene mutations were previously detected in haematopoietic malignancies, melanoma, and some solid tumours [19,23]. TET2 mutations were frequently detected in myeloid malignancies (~15%) [33]. Moreover, genetic studies have shown that TET2 is essential for the self-renewal and differentiation of haematopoietic stem cells in mouse models and have confirmed that TET2 inactivation leads to the development of myeloid malignancies [34-36]. TET2 mutations have been detected in AML, CMML, MPD, and MDS [37], and the mutation frequency of TET2 is significantly higher than that of TET1 and TET3. In solid tumours, TET gene mutations were observed in COAD [38] and Clear-Cell Renal Cell Carcinoma (CCRCC) [39]. Interestingly, most DNMT/TET genes showed high mutation frequencies in UCEC, which is a cancer type with a high global mutation burden [40]. DNMT/TET gene mutations were rare in CHOL, PCPG, and THCA. Furthermore, TET genes usually function as cancer suppressors. Indeed, TET genes were reported to be the targets of oncogenic miRNAs [17], and reduced TET gene expression is often detected in cancer cells [24]. Furthermore, TET gene mutations may interfere with TET gene expression, which plays a pivotal role in human tumours [41,42]. Indeed, our results showed that TET2 and TET3 mutations were significantly related to their expression in some cancers.
Sporadic CNVs significantly affect genomic stability in cancer, and CNVs are observed in nearly 80% of cancers [43,44]. We noticed that DNMT3B exhibited extensive CNV in different cancers, and almost all DNMT/TET genes showed copy number deletions in BLCA, ESCA, LUSC and LUAD. Additionally, significant copy number changes were usually related to alterations in the expression of the corresponding genes [45]. We found that CNV and DNMT/TET gene expression levels were associated with multiple cancer types. Together, these findings strongly suggest that genetic changes might contribute to DNMT/TET gene expression changes in carcinogenesis. The potential regulatory mechanism related to this deserves further exploration.
We found that most DNMT/TET genes were positively correlated with each other, especially DNMT3A with TET1, TET2 with TET3, and TET1 with TET3. DNMT/TET genes might have a synergistic effect in tumorigenesis, although additional investigation is necessary to determine the mechanism of interaction between these genes in oncogenesis.
Our results indicate that DNMT/TET gene expression is significantly associated with multiple cancer-related pathways, especially in UV response DN, mitotic spindle, cholesterol homeostasis, TGF beat signalling, xenobiotic metabolism, G2/M checkpoint, and E2F targets. Individual DNMT/TET genes presented different associations with distinct cancer-related pathways, suggesting that each DNMT/TET gene may have different functions. These results are consistent with those of a previous study showing that DNMT/TET genes have distinct expression patterns and functions [9,46]. The methylation of the mouse oocyte genome was less than 50%, which is significantly lower than that of the sperm genome and is related to DNMT1 cytoplasmic retention [47,48]. TET1 was highly expressed in mouse ESCs. Unlike TET1 expression, TET3 expression was mainly confined to oocytes and zygotes, where it appeared to contribute to the active demethylation or conversion of 5 mC to 5 hmC in male prokaryotes after fertilization [49]. Further investigations are required to analyse the common and diverse functions of these genes in tumorigenesis.
Analysis of the relationship between pan-oncogene expression and immune cell infiltration showed that NK, CD4+ T, and Tfh cells were most significantly associated with DNTM/TET genes and with TET2, TRDMT1, and TET3 in particular. The TET protein family has an important influence on maintaining immune system homeostasis by driving Treg cells, and changes in this family may result in the occurrence of cancers [50,51].
Another study suggested that TET2 regulates Th1 cells, playing a pivotal role in the prevention of excessive inflammation in Experimental Autoimmune Encephalomyelitis (EAE) [52]. Together, these findings suggest that further studies of DNMT/TET genes may provide novel anti-cancer therapeutics.
TRIM8 and CIRBP are DNMT3B-related methylated genes shared among most cancers with different DNMT3B expression. TRIM8 plays a dual role as a tumor suppressor gene and an oncogene. Consistent with the findings of previous studies, in our results, the TRIM8 expression level showed a downregulation trend in BRCA [53].
Tian et al. found that TRIM8 is downregulated in BRCA and that knocking out TRIM8 can significantly enhance the proliferation and migration of BRCA cells. CIRBP is a stress response protein that promotes cancer development [54]. Chen et al. found that CIRBP is a DNA methylation marker associated with occult lymph node metastasis in NSCLC, which has important value in predicting the prognosis of early NSCLC [55,56].
CIRBP is significantly decreased in UCEC patients and is a major risk factor for survival. The DNA methylation event of CIRBP is a prognostic indicator of gynaecological cancers [57,58]. In BRCA, CIRBP promotes proliferation and clonogenesis, which is associated with a poor prognosis. Next, we found that DNMT3B-related methylated genes were mainly enriched in Salmonella infection, bacterial invasion of epithelial cells and the MAPK signalling pathway. The MAPK signalling pathway, in particular, is involved in 5 out of the 12 cancers we analysed. The MAPK signalling pathway regulates various aspects of cell function and is often changed in cancers. Previous studies found that hypermethylation inhibits the expression of different genes in different cancers and regulates the MAPK signalling pathway to promote the development of caners [59]. In cervical cancer, DNMT3B mediates PTPRR hypermethylation, inhibits the MAPK signalling pathway, and promotes metastasis [60]. IRAK3 hypermethylation activates the MAPK signalling to promote glioma development [61]. In liver cancer, abnormally methylated DEGs were also mainly enriched in the MAPK signalling pathway [62,63]. Current evidence suggests that the MAPK signalling pathway is a viable target for cancer therapy, while for MAPK inhibitor-resistant cells, epigenetic therapy may bring great hope for the development of new and effective therapies.
Finally, we evaluated the value of DNMT/TET genes in pan-cancer prognosis. Most DNMT/TET genes were correlated with a poor prognosis in ACC, MESO, and LIHC and were correlated with a good prognosis in THYM. Survival analysis also showed that high DNMT gene expression, except that of DMAP1, was significantly associated with poor prognosis in pan-cancer and that TET1 and TET2 showed no statistically significant relationship with overall survival in pan-cancer. Early studies showed that DNMT genes were poor prognostic factors in diverse cancers, including AML [64], STAD [65] and LUAD [66]. More interestingly, our results revealed that TRDMT1 and DNMT3A showed distinctly disparate prognoses across cancers. DNMT3A expression is related to a poor survival rate in haematologic cancer [67] and CMML [68], and in AML, DNMT3A acts as a tumour suppressor [69]. This could be explained by different DNMT3A expression patterns among cancers. Taken together, these findings suggest that DNMT genes can serve as prognostic predictors in pan-cancer. Future studies are needed to reveal the critical role of DNMT/TET genes in the prognosis of various tumours.
Table 3:
| |
Breast cancer |
Carcinoid |
| Protein expression gene symbol |
High |
Medium |
Low |
Not.detected |
High |
Medium |
Low |
Not detected |
| DNMT1 |
0 |
3 |
5 |
3 |
0 |
0 |
3 |
1 |
| TRDMT1 |
1 |
9 |
1 |
0 |
2 |
2 |
0 |
0 |
| DNMT3A |
11 |
1 |
0 |
0 |
1 |
3 |
0 |
0 |
| DNMT3B |
0 |
2 |
6 |
2 |
0 |
0 |
2 |
2 |
| DNMT3L |
0 |
0 |
4 |
8 |
0 |
0 |
3 |
1 |
| DMAP1 |
0 |
4 |
8 |
0 |
0 |
0 |
3 |
1 |
| TET2 |
7 |
5 |
0 |
0 |
0 |
4 |
0 |
0 |
| TET3 |
1 |
0 |
1 |
10 |
0 |
0 |
0 |
4 |
| TET1 |
NA |
NA |
NA |
NA |
NA |
NA |
NA |
NA |
| |
Cervical cancer |
Colorectal cancer |
| Protein expression gene symbol |
High |
Medium |
Low |
Not.detected |
High |
Medium |
Low |
Not.detected |
| DNMT1 |
0 |
3 |
4 |
5 |
0 |
5 |
1 |
5 |
| TRDMT1 |
0 |
9 |
3 |
0 |
3 |
9 |
0 |
0 |
| DNMT3A |
9 |
2 |
0 |
1 |
10 |
2 |
0 |
0 |
| DNMT3B |
0 |
3 |
7 |
2 |
0 |
2 |
5 |
4 |
| DNMT3L |
0 |
3 |
6 |
1 |
0 |
2 |
5 |
3 |
| DMAP1 |
0 |
0 |
6 |
6 |
0 |
0 |
10 |
2 |
| TET2 |
10 |
2 |
0 |
0 |
7 |
5 |
0 |
0 |
| TET3 |
0 |
1 |
4 |
6 |
0 |
0 |
1 |
11 |
| TET1 |
NA |
NA |
NA |
NA |
NA |
NA |
NA |
NA |
Table 4:
| Cancer type |
Gene symbol |
Mutation group (Mean±SD) |
Control group (Mean±SD) |
P value |
| COAD |
DNMT1 |
78.24±41.74 |
56.72±39.53 |
0.003 |
| COAD |
DNMT3L |
0.01±0.01 |
0.00±0.01 |
0.021 |
| COAD |
TET2 |
7.11±4.80 |
5.94±9.37 |
0.001 |
| ESCA |
DNMT1 |
132.20±84.82 |
62.85±51.08 |
0.015 |
| GBM |
TET3 |
12.68±2.58 |
8.10±7.49 |
0.049 |
| LIHC |
DNMT3A |
9.81±6.47 |
4.51±7.58 |
0.014 |
| LIHC |
TET2 |
0.37±0.43 |
0.79±1.14 |
0.028 |
| LUAD |
DNMT3A |
32.77±36.23 |
20.54±23.48 |
0.017 |
| LUAD |
TET3 |
21.99±15.54 |
12.53±11.80 |
<0.001 |
| PRAD |
DNMT1 |
26.42±15.04 |
12.37±7.92 |
0.02 |
| READ |
TET1 |
0.04±0.03 |
0.09±0.11 |
0.037 |
| SARC |
DNMT3A |
61.02±85.90 |
14.30±20.17 |
0.033 |
| STAD |
DNMT1 |
51.51±22.37 |
46.51±79.44 |
0.031 |
| STAD |
DNMT3A |
4.68±3.42 |
9.79±11.37 |
0.02 |
| UCEC |
DNMT1 |
105.60±81.18 |
75.34±79.02 |
<0.001 |
| UCEC |
TET2 |
9.37±7.66 |
8.60±12.78 |
0.04 |
Table 5:
| Gene |
Cancer-related pathway |
Corr |
Pvalue |
| DMAP1 |
XENOBIOTIC_METABOLISM |
0.289 |
5.05E-199 |
| DMAP1 |
OXIDATIVE_PHOSPHORYLATION |
0.280 |
1.9536E-186 |
| DMAP1 |
MYOGENESIS |
0.259 |
9.7535E-159 |
| DMAP1 |
DNA_REPAIR |
0.372 |
0 |
| DMAP1 |
INFLAMMATORY_RESPONSE |
-0.269 |
3.5184E-172 |
| DNMT1 |
PEROXISOME |
0.279 |
7.2224E-185 |
| DNMT1 |
E2F_TARGETS |
0.321 |
3.8397E-249 |
| DNMT1 |
UV_RESPONSE_DN |
-0.305 |
8.9777E-224 |
| DNMT1 |
PROTEIN_SECRETION |
-0.310 |
4.6683E-231 |
| DNMT1 |
KRAS_SIGNALING_UP |
-0.314 |
1.2484E-236 |
| DNMT1 |
ADIPOGENESIS |
-0.311 |
8.3374E-232 |
| TRDMT1 |
UV_RESPONSE_DN |
0.516 |
0 |
| TRDMT1 |
TGF_BETA_SIGNALING |
0.399 |
0 |
| TRDMT1 |
PROTEIN_SECRETION |
0.400 |
0 |
| TRDMT1 |
PI3K_AKT_MTOR_SIGNALING |
0.321 |
5.5843E-249 |
| TRDMT1 |
NOTCH_SIGNALING |
0.261 |
3.5191E-161 |
| TRDMT1 |
MITOTIC_SPINDLE |
0.424 |
0 |
| TRDMT1 |
HEME_METABOLISM |
0.431 |
0 |
| TRDMT1 |
ANDROGEN_RESPONSE |
0.335 |
8.8135E-272 |
| TRDMT1 |
ESTROGEN_RESPONSE_LATE |
-0.305 |
1.0938E-222 |
| TRDMT1 |
CHOLESTEROL_HOMEOSTASIS |
-0.380 |
0 |
| TET2 |
MITOTIC_SPINDLE |
0.405 |
0 |
| TET2 |
G2M_CHECKPOINT |
0.250 |
0 |
| TET2 |
UV_RESPONSE_DN |
0.371 |
3.0393E-219 |
| TET2 |
TGF_BETA_SIGNALING |
0.401 |
5.8313E-119 |
| TET2 |
PROTEIN_SECRETION |
0.302 |
4.94712E-35 |
| TET2 |
ANDROGEN_RESPONSE |
0.308 |
0 |
| TET2 |
XENOBIOTIC_METABOLISM |
-0.339 |
2.6013E-28 |
| TET2 |
PEROXISOME |
-0.327 |
4.4254E-227 |
| TET2 |
PANCREAS_BETA_CELLS |
-0.294 |
0.000743703 |
| TET2 |
OXIDATIVE_PHOSPHORYLATION |
-0.425 |
0 |
| TET2 |
MYOGENESIS |
-0.370 |
0 |
| TET2 |
FATTY_ACID_METABOLISM |
-0.333 |
7.26E-268 |
| TET2 |
COAGULATION |
-0.321 |
1.25E-248 |
| TET2 |
CHOLESTEROL_HOMEOSTASIS |
-0.369 |
0 |
| DNMT3B |
MYOGENESIS |
-0.259 |
4.328E-159 |
| TET1 |
WNT_BETA_CATENIN_SIGNALING |
0.328 |
7.1372E-261 |
| TET1 |
UV_RESPONSE_DN |
0.441 |
0 |
| TET1 |
UNFOLDED_PROTEIN_RESPONSE |
0.307 |
4.1181E-226 |
| TET1 |
TGF_BETA_SIGNALING |
0.338 |
2.2766E-277 |
| TET1 |
PI3K_AKT_MTOR_SIGNALING |
0.265 |
2.7704E-166 |
| TET1 |
NOTCH_SIGNALING |
0.254 |
7.4858E-153 |
| TET1 |
MITOTIC_SPINDLE |
0.510 |
0 |
| TET1 |
G2M_CHECKPOINT |
0.450 |
0 |
| TET1 |
E2F_TARGETS |
0.306 |
4.8289E-224 |
| TET1 |
XENOBIOTIC_METABOLISM |
-0.290 |
4.0068E-201 |
| TET1 |
TNFA_SIGNALING_VIA_NFKB |
-0.285 |
5.6479E-193 |
| TET1 |
COAGULATION |
-0.356 |
0 |
| TET1 |
CHOLESTEROL_HOMEOSTASIS |
-0.338 |
6.0664E-278 |
| TET1 |
ANGIOGENESIS |
-0.327 |
6.0915E-259 |
| TET3 |
UNFOLDED_PROTEIN_RESPONSE |
0.441 |
0 |
| TET3 |
TGF_BETA_SIGNALING |
0.316 |
1.207E-239 |
| TET3 |
MYC_TARGETS_V2 |
0.385 |
0 |
| TET3 |
MYC_TARGETS_V1 |
0.338 |
5.7629E-277 |
| TET3 |
MITOTIC_SPINDLE |
0.590 |
0 |
| TET3 |
G2M_CHECKPOINT |
0.608 |
0 |
| TET3 |
E2F_TARGETS |
0.420 |
0 |
| TET3 |
HEDGEHOG_SIGNALING |
-0.274 |
9.8594E-178 |
| TET3 |
XENOBIOTIC_METABOLISM |
-0.506 |
0 |
| TET3 |
PEROXISOME |
-0.345 |
1.6353E-290 |
| TET3 |
PANCREAS_BETA_CELLS |
-0.350 |
1.7035E-299 |
| TET3 |
OXIDATIVE_PHOSPHORYLATION |
-0.373 |
0 |
| TET3 |
MYOGENESIS |
-0.530 |
0 |
| TET3 |
FATTY_ACID_METABOLISM |
-0.440 |
0 |
| TET3 |
COAGULATION |
-0.529 |
0 |
| TET3 |
CHOLESTEROL_HOMEOSTASIS |
-0.322 |
8.3792E-251 |
| TET3 |
BILE_ACID_METABOLISM |
-0.415 |
0 |
| TET3 |
ANGIOGENESIS |
-0.456 |
0 |
| DNMT3A |
WNT_BETA_CATENIN_SIGNALING |
0.342 |
4.2753E-284 |
| DNMT3A |
UV_RESPONSE_DN |
0.383 |
0 |
| DNMT3A |
UNFOLDED_PROTEIN_RESPONSE |
0.323 |
1.7172E-252 |
| DNMT3A |
PI3K_AKT_MTOR_SIGNALING |
0.265 |
1.7437E-166 |
| DNMT3A |
NOTCH_SIGNALING |
0.259 |
7.5755E-159 |
| DNMT3A |
MITOTIC_SPINDLE |
0.516 |
0 |
| DNMT3A |
HEME_METABOLISM |
0.268 |
1.6763E-170 |
| DNMT3A |
G2M_CHECKPOINT |
0.434 |
0 |
| DNMT3A |
E2F_TARGETS |
0.318 |
3.4526E-244 |
| DNMT3A |
DNA_REPAIR |
0.305 |
6.2327E-223 |
| DNMT3A |
INFLAMMATORY_RESPONSE |
-0.258 |
5.6146E-157 |
| DNMT3A |
IL6_JAK_STAT3_STAT3 |
-0.324 |
7.7177E-253 |
| DNMT3A |
ESTROGEN_RESPONSE_LATE |
-0.270 |
1.8872E-172 |
| DNMT3A |
CHOLESTEROL_HOMEOSTASIS |
-0.295 |
7.4933E-208 |
Table 6:
| Gene |
SCC |
P-value |
FDR (BH) |
| SLC9A3R1 |
0.314627914 |
2.63E-05 |
0.003381348 |
| ELOVL5 |
0.334658343 |
7.22E-06 |
0.001562081 |
| UBTF |
0.35363752 |
1.95E-06 |
0.000697805 |
| GOT2 |
0.323280351 |
1.52E-05 |
0.002615726 |
| UHRF1 |
0.304869794 |
4.77E-05 |
0.004656639 |
| PWWP2B |
0.308118265 |
3.92E-05 |
0.00423937 |
| PCBP2 |
0.304843852 |
4.78E-05 |
0.004656639 |
| CCDC17 |
0.314474064 |
2.65E-05 |
0.003381348 |
| SLC27A6 |
0.348929803 |
2.72E-06 |
0.000838196 |
| MARCKSL1 |
0.303971256 |
5.04E-05 |
0.004873547 |
| ABHD2 |
0.347647825 |
2.97E-06 |
0.000859503 |
| C18orf1 |
0.3001247 |
6.33E-05 |
0.005589898 |
| BUB3 |
0.320803731 |
1.78E-05 |
0.002779214 |
| RAB24 |
0.323670324 |
1.48E-05 |
0.002582359 |
| LRIG1 |
0.342539436 |
4.23E-06 |
0.001051741 |
| CDC42SE2 |
0.306724557 |
4.27E-05 |
0.004426819 |
| RARA |
0.358553118 |
1.37E-06 |
0.00053952 |
| CREB3L2 |
0.300978956 |
6.51E-05 |
0.005666182 |
| DCDC2B |
0.330388507 |
9.58E-06 |
0.001987768 |
| IRS1 |
0.3016041 |
5.80E-05 |
0.005282358 |
| CCDC92 |
0.303642085 |
5.14E-05 |
0.004923191 |
| DEPDC6 |
0.330390681 |
9.58E-06 |
0.001987768 |
| MUC6 |
0.307047204 |
4.19E-05 |
0.004386785 |
| VWA3A |
0.339285462 |
5.29E-06 |
0.001236993 |
| ZFP36L2 |
0.361205626 |
1.13E-06 |
0.00049306 |
| P4HB |
0.344182652 |
3.78E-06 |
0.001011127 |
| TSC22D4 |
0.301922657 |
5.69E-05 |
0.005206876 |
| WDR6 |
0.376562787 |
3.56E-07 |
0.000223656 |
| HSBP1 |
0.317284987 |
2.23E-05 |
0.003116204 |
| SUGT1L1 |
0.317543928 |
2.19E-05 |
0.003116204 |
| ADORA2B |
0.329212483 |
1.04E-05 |
0.002125464 |
| EMP2 |
0.311515492 |
3.19E-05 |
0.003702523 |
| SMAD9 |
0.300077413 |
6.35E-05 |
0.005589898 |
| SIPA1L2 |
0.322492701 |
1.60E-05 |
0.002638416 |
| TBC1D10B |
0.423686493 |
6.99E-09 |
1.59E-05 |
| ATN1 |
0.33804574 |
5.75E-06 |
0.001329891 |
| SH3BP4 |
0.350020341 |
2.52E-06 |
0.000816701 |
| ACSS1 |
0.310002335 |
3.50E-05 |
0.003887062 |
| ZNF747 |
0.313008605 |
2.91E-05 |
0.00352036 |
| ZFYVE28 |
0.365401079 |
8.28E-07 |
0.00039639 |
| ANKRD13D |
0.341099586 |
4.67E-06 |
0.00111333 |
| TMEM87B |
0.424405545 |
6.55E-09 |
1.59E-05 |
| SSR3 |
0.31300797 |
2.91E-05 |
0.00352036 |
| PXK |
0.302637242 |
5.46E-05 |
0.005129935 |
| BTG2 |
0.3438707 |
3.86E-06 |
0.001011127 |
| KIAA1984 |
0.321027586 |
1.76E-05 |
0.002761302 |
| CDK2AP1 |
0.36227087 |
1.04E-06 |
0.000476748 |
| DUSP6 |
0.323705509 |
1.48E-05 |
0.002582359 |
| PTCH1 |
0.327013285 |
1.20E-05 |
0.002334521 |
| TTRAP |
0.334892825 |
7.11E-06 |
0.00155451 |
| DHX58 |
0.341396057 |
4.58E-06 |
0.001110038 |
| ARID4B |
0.35776736 |
1.45E-06 |
0.00056013 |
| NFKBIA |
0.316643574 |
2.32E-05 |
0.003171761 |
| SIDT1 |
0.300569208 |
6.17E-05 |
0.005541295 |
| XBP1 |
0.472734385 |
6.64E-11 |
9.01E-07 |
| CCDC57 |
0.344803545 |
3.87E-06 |
0.001011127 |
| WDR51B |
0.303244557 |
5.54E-05 |
0.005133756 |
| KIAA0649 |
0.373229895 |
4.59E-07 |
0.000263988 |
| TENC1 |
0.377811476 |
3.23E-07 |
0.000209648 |
| ZNF787 |
0.312794906 |
2.95E-05 |
0.003526748 |
| TRIM8 |
0.345536928 |
3.44E-06 |
0.00095444 |
| MYCN |
0.308047696 |
3.94E-05 |
0.00423937 |
| HNRNPA3 |
0.336197961 |
6.51E-06 |
0.001455993 |
| TRDMT1 |
0.357068316 |
1.52E-06 |
0.000567324 |
| PTCHD2 |
0.39135818 |
1.11E-07 |
0.000117058 |
| BBS2 |
0.321969143 |
1.65E-05 |
0.002706064 |
| CPEB3 |
0.300791821 |
6.09E-05 |
0.005493291 |
| TP53INP2 |
0.386606615 |
1.62E-07 |
0.000130303 |
| EEPD1 |
0.311181784 |
3.25E-05 |
0.003720413 |
| DCAF5 |
0.312559807 |
2.99E-05 |
0.00353627 |
| KIAA1737 |
0.370626122 |
6.80E-07 |
0.000333523 |
| MED18 |
0.314968262 |
2.57E-05 |
0.003355768 |
| CLK1 |
0.374101831 |
4.30E-07 |
0.000261962 |
| FAM63A |
0.347690276 |
2.96E-06 |
0.000859503 |
| NPDC1 |
0.34876126 |
2.75E-06 |
0.000838196 |
| BTF3 |
0.336708758 |
6.29E-06 |
0.001422658 |
| ARL4D |
0.300047934 |
6.36E-05 |
0.005589898 |
| ZMAT3 |
0.303185424 |
5.28E-05 |
0.005035451 |
| LRRC14 |
0.326664654 |
1.22E-05 |
0.002342537 |
| CTNNA1 |
0.323523994 |
1.59E-05 |
0.002638416 |
| LRP5L |
0.319623272 |
1.92E-05 |
0.002863759 |
| BTN3A3 |
0.305847976 |
4.50E-05 |
0.004550621 |
| HMGXB3 |
0.318237401 |
2.10E-05 |
0.003034495 |
| C10orf95 |
0.30677027 |
4.26E-05 |
0.004426819 |
| CIB1 |
0.386979693 |
1.57E-07 |
0.000130303 |
| C2orf62 |
0.38976923 |
1.26E-07 |
0.000126427 |
| LOC222699 |
0.32596787 |
1.28E-05 |
0.002358883 |
| MADD |
0.369940493 |
5.89E-07 |
0.000307611 |
| NDRG2 |
0.322687038 |
1.58E-05 |
0.002638416 |
| ICK |
0.313354948 |
2.84E-05 |
0.003511089 |
| CD74 |
0.347109962 |
3.09E-06 |
0.000874555 |
| RBM4 |
0.305430726 |
4.62E-05 |
0.004643157 |
| CALR |
0.412203848 |
1.93E-08 |
2.77E-05 |
| MBLAC1 |
0.302961946 |
5.35E-05 |
0.005079013 |
| PKP4 |
0.370473047 |
5.66E-07 |
0.000307611 |
| KIAA1324 |
0.387296399 |
1.53E-07 |
0.000130303 |
| RPSA |
0.351680073 |
2.24E-06 |
0.000740765 |
| UBE2N |
0.34545357 |
3.46E-06 |
0.00095444 |
| MYO5C |
0.358680137 |
1.36E-06 |
0.00053952 |
| TREX1 |
0.41620649 |
1.36E-08 |
2.28E-05 |
| C14orf2 |
0.307915174 |
3.97E-05 |
0.004248671 |
| KCNK15 |
0.308738793 |
3.78E-05 |
0.004175847 |
| C16orf58 |
0.32849787 |
1.08E-05 |
0.00220475 |
| MDM4 |
0.324605194 |
1.40E-05 |
0.002509249 |
| NUMA1 |
0.305009758 |
4.73E-05 |
0.004656639 |
| PDDC1 |
0.443789473 |
1.08E-09 |
5.42E-06 |
| SNAP23 |
0.31303709 |
2.90E-05 |
0.00352036 |
| UNC119B |
0.45392783 |
4.00E-10 |
2.68E-06 |
| GNMT |
0.31706355 |
2.26E-05 |
0.003116204 |
| AKTIP |
0.31541187 |
2.50E-05 |
0.003313101 |
| TMEM109 |
0.407574416 |
2.87E-08 |
3.61E-05 |
| IFNGR1 |
0.31961568 |
1.92E-05 |
0.002863759 |
| HNRNPH1 |
0.413333506 |
1.75E-08 |
2.70E-05 |
| RSL1D1 |
0.300833294 |
6.71E-05 |
0.005772691 |
| ISOC1 |
0.32054648 |
1.81E-05 |
0.002779889 |
| FXC1 |
0.320393518 |
1.83E-05 |
0.002779889 |
| UQCRH |
0.315696997 |
2.46E-05 |
0.003276186 |
| ERGIC1 |
0.30520786 |
4.68E-05 |
0.004656639 |
| TRPM7 |
0.302552341 |
5.48E-05 |
0.005131977 |
| ABCC11 |
0.301103303 |
5.98E-05 |
0.005417148 |
| NACA |
0.305001403 |
4.74E-05 |
0.004656639 |
| UAP1L1 |
0.341004272 |
4.70E-06 |
0.00111333 |
| SCAMP4 |
0.349471666 |
2.62E-06 |
0.000829093 |
| UQCRHL |
0.387182969 |
1.55E-07 |
0.000130303 |
| GPBP1L1 |
0.307660923 |
4.03E-05 |
0.004248671 |
| LOC400931 |
0.379306523 |
2.88E-07 |
0.000199565 |
| CYB561 |
0.343277202 |
4.03E-06 |
0.001025044 |
| RBM5 |
0.326387353 |
1.24E-05 |
0.002355402 |
| RPS7 |
0.32593101 |
1.28E-05 |
0.002358883 |
| C10orf104 |
0.324312243 |
1.60E-05 |
0.002638416 |
| SFRS4 |
0.360891226 |
1.15E-06 |
0.000493794 |
| LRRC41 |
0.300435483 |
6.54E-05 |
0.00566901 |
| CEL |
0.344775133 |
3.63E-06 |
0.000986842 |
| TTC28 |
0.379721595 |
2.79E-07 |
0.000199565 |
| EID2B |
0.317123517 |
2.25E-05 |
0.003116204 |
| GUF1 |
0.312183905 |
3.06E-05 |
0.003598133 |
| RPS3 |
0.422699085 |
7.64E-09 |
1.59E-05 |
| HPS1 |
0.308045429 |
3.94E-05 |
0.00423937 |
| HFE |
0.315794501 |
2.44E-05 |
0.003276186 |
| RP5-1022P6.2 |
0.302426019 |
5.53E-05 |
0.005133756 |
| FLJ25006 |
0.317627894 |
2.18E-05 |
0.003116204 |
| LMAN1 |
0.361841221 |
1.28E-06 |
0.000526319 |
| RSPH1 |
0.351632128 |
2.25E-06 |
0.000740765 |
| B4GALT1 |
0.321577085 |
1.70E-05 |
0.002752275 |
| APOL2 |
0.321233711 |
1.73E-05 |
0.002755711 |
| USP54 |
0.325840212 |
1.29E-05 |
0.002358883 |
| TXNL4B |
0.398130286 |
6.35E-08 |
7.52E-05 |
| MIR200B |
0.306110296 |
4.43E-05 |
0.00451502 |
| SNORD1A |
0.34756195 |
2.99E-06 |
0.000859503 |
| C1orf194 |
0.387296399 |
1.53E-07 |
0.000130303 |
| IL6ST |
0.311437483 |
3.20E-05 |
0.003702523 |
| EEF1B2 |
0.359952809 |
1.24E-06 |
0.000517782 |
| CIRBP |
0.42233583 |
7.89E-09 |
1.59E-05 |
| RPS8 |
0.324877011 |
1.37E-05 |
0.002487842 |
| KRTAP5-7 |
0.306143133 |
4.42E-05 |
0.00451502 |
| TAPBPL |
0.310334317 |
3.43E-05 |
0.003829978 |
| ACOX1 |
0.352616138 |
2.09E-06 |
0.000726544 |
| SERP1 |
0.349355076 |
2.64E-06 |
0.000829093 |
| ARFIP2 |
0.320393518 |
1.83E-05 |
0.002779889 |
| HEATR5B |
0.314893231 |
2.59E-05 |
0.003355768 |
| DNAJB11 |
0.42946264 |
4.13E-09 |
1.39E-05 |
| OGFOD1 |
0.373560765 |
4.48E-07 |
0.000263988 |
| SNORD20 |
0.411042417 |
2.13E-08 |
2.86E-05 |
| MIR93 |
0.310445973 |
3.40E-05 |
0.003829978 |
| LOC100129726 |
0.361205626 |
1.13E-06 |
0.00049306 |
| MIR25 |
0.36497935 |
8.54E-07 |
0.000399474 |
| SNORD49A |
0.321217918 |
1.84E-05 |
0.002779889 |
| SNORD19B |
0.311746429 |
3.14E-05 |
0.003675005 |
| LOC100129387 |
0.31292075 |
2.92E-05 |
0.00352036 |
| SNORA33 |
0.311099057 |
3.27E-05 |
0.003720413 |
| SNORD4B |
0.324296661 |
1.42E-05 |
0.002536993 |
| B3GALT2 |
0.303754107 |
5.10E-05 |
0.0049137 |
| SNORD34 |
0.322559724 |
1.59E-05 |
0.002638416 |
| RPL13AP5 |
0.328605786 |
1.74E-05 |
0.002755711 |
| SNORD35A |
0.323299601 |
2.03E-05 |
0.002971055 |
| MYCNOS |
0.308047696 |
3.94E-05 |
0.00423937 |
| LOC100289511 |
0.393554066 |
9.25E-08 |
0.000103372 |
| MIR26A2 |
0.307683691 |
4.03E-05 |
0.004248671 |
| NUDT22 |
0.371053204 |
5.42E-07 |
0.000302779 |
| MIR1306 |
0.383322253 |
2.28E-07 |
0.000176472 |
| SCARNA12 |
0.335040004 |
7.04E-06 |
0.00155451 |
| NDUFA8 |
0.318686678 |
2.04E-05 |
0.002971055 |
| SNORD33 |
0.314361856 |
2.67E-05 |
0.003381348 |
| RPS15AP10 |
0.307660923 |
4.03E-05 |
0.004248671 |
| C1orf189 |
0.342151856 |
4.35E-06 |
0.00106691 |
| SNORD124 |
0.36944685 |
6.12E-07 |
0.000307611 |
| MIR26B |
0.435527444 |
2.36E-09 |
9.49E-06 |
| SNORD37 |
0.417111858 |
1.26E-08 |
2.28E-05 |
| SNORA4 |
0.327954102 |
1.12E-05 |
0.002239222 |
| MIR1282 |
0.333739563 |
7.68E-06 |
0.001643124 |
| SNORD18C |
0.332207607 |
8.50E-06 |
0.001799934 |
| MIR1280 |
0.32674342 |
1.22E-05 |
0.002342537 |
| RPL12 |
0.300365959 |
6.24E-05 |
0.00555867 |
| LOC440926 |
0.382179759 |
3.19E-07 |
0.000209648 |
| H3F3A |
0.468647024 |
8.96E-11 |
9.01E-07 |
| SNORD32A |
0.317034071 |
2.26E-05 |
0.003116204 |
| MIR27A |
0.306640929 |
4.29E-05 |
0.004426819 |
| MIR23A |
0.315984784 |
2.42E-05 |
0.003275745 |
| SNORA15 |
0.353427625 |
1.98E-06 |
0.000697805 |
| SNORD51 |
0.343391786 |
3.99E-06 |
0.001025044 |
| SNORA1 |
0.354183482 |
1.87E-06 |
0.000685207 |
| LOC645851 |
0.327657507 |
1.15E-05 |
0.002260574 |
| SNORA53 |
0.313805467 |
2.77E-05 |
0.003435438 |
| SNORD19 |
0.323613914 |
1.49E-05 |
0.002582359 |
| SNORA65 |
0.300365959 |
6.24E-05 |
0.00555867 |
| UGT2B17 |
0.304993069 |
4.74E-05 |
0.004656639 |
Table 7:The anomalous pathways enriched by DNMT3B-related methylated genes in cancers.
| Pathway |
Cancers |
| Salmonella infection |
BLCA BRCA COADREAD LUSC STAD |
| Bacterial invasion of epithelial cells |
BLCA ESCA LUADLUSC STAD |
| MAPK signaling pathway |
BRCA KIRP LUADLUSC STAD |
| Ribosome |
CHOL ESCA HNSCUCEC |
| Th17 cell differentiation |
CHOL LUAD STAD UCEC |
| Leishmaniasis |
CHOL LIHC LUAD UCEC |
| Gastric acid secretion |
BLCA COADREAD ESCAKIRP |
| Endocytosis |
BLCA COADREAD LUSCSTAD |
| Neurotrophin signaling pathway |
BLCA ESCA LUADLUSC |
| Apoptosis Yersinia infection |
BLCA LUAD LUSCSTAD |
Declarations
Authorship contributions: YP designed the research and provided the technical supports. ZZL, QHL and SPC conducted data retrieval and analysis, and wrote the manuscript text. FHJ and COY prepared the figures and tables. All authors reviewed the manuscript.
Fundings: This study was supported by grants from the China Postdoctoral Science Foundation (2021MD703842) and Liaoning Provincial Natural Science Foundation (2024-MS-16).
Data availability: All the data used to support the results of this study can be found in the public databases:
Gene Cards: https://www.genecards.org/;
TCGA database: https://cancergenome.nih.gov/;
UCSC XENA: https://xenabrowser.net/;
Human Protein Atlas Datasets (HPA): https://www.proteinatlas.org/;
Linked Omics database: https://www.linkedomics.org.;
R software v4.1.0: https://www.r-project.org.
Conflicts of interest: The authors declare that there is no conflicts of interest regarding the publication of this article.
References
- You JS, PA Jones. Cancer genetics and epigenetics: two sides of the same coin? Cancer cell. 2012; 22(1).
- Baylin SB, PA Jones. A decade of exploring the cancer epigenome - biological and translational implications. Nature reviews. Cancer. 2011; 11(10): 726-734.
- Verma M. Cancer control and prevention: nutrition and epigenetics. Current opinion in clinical nutrition and metabolic care. 2013; 16(4): 376-384.
- Issa JP. Cancer prevention: Epigenetics steps up to the plate. Cancer prevention research (Philadelphia, Pa.). 2008; 1(4): 219-222.
- Kelly AD, JPJ Issa, The promise of epigenetic therapy: Reprogramming the cancer epigenome. Current opinion in genetics & development. 2017; 42: 68-77.
- Nowacka-Zawisza M, E Wiśnik. DNA methylation and histone modifications as epigenetic regulation in prostate cancer (Review). Oncology reports. 2017; 38(5): 2587-2596.
- Suzuki MM, A Bird. DNA methylation landscapes: provocative insights from epigenomics. Nature reviews. Genetics. 2008; 9(6): 465-476.
- Pastor WA, L Aravind, A Rao. TETonic shift: Biological roles of TET proteins in DNA demethylation and transcription. Nature reviews. Molecular cell biology. 2013; 14(6): 341-356.
- Shen L, et al. Mechanism and function of oxidative reversal of DNA and RNA methylation. Annual review of biochemistry. 2014; 83: 585-614.
- Uysal F, G Akkoyunlu, S Ozturk. Dynamic expression of DNA methyltransferases (DNMTs) in oocytes and early embryos. Biochimie. 2015; 116: 103-113.
- Ito S, et al. Role of Tet proteins in 5mC to 5hmC conversion, ES-cell self-renewal and inner cell mass specification. Nature. 2010; 466(7310): 1129-1133.
- Rasmussen KD, K Helin. Role of TET enzymes in DNA methylation, development, and cancer. Genes & development. 2016; 30(7): 733-750.
- Gu T, et al. DNMT3A and TET1 cooperate to regulate promoter epigenetic landscapes in mouse embryonic stem cells. Genome biology. 2018; 19(1): 88.
- Li Y, et al. Epigenetically deregulated miR-200c is involved in a negative feedback loop with DNMT3a in gastric cancer cells. Oncology reports. 2016; 36(4): 2108-2116.
- Thienpont B, et al. Tumour hypoxia causes DNA hypermethylation by reducing TET activity. Nature. 2016; 537(7618): 63-68.
- Ma J, et al. BARX2 expression is downregulated by CpG island hypermethylation and is associated with suppressed cell proliferation and invasion of gastric cancer cells. Oncology reports. 2020; 43(6): 1805-1818.
- Song SJ, et al. MicroRNA-antagonism regulates breast cancer stemness and metastasis via TET-family-dependent chromatin remodeling. Cell. 2013; 154(2): 311-324.
- Zhang J, et al. DNA Methyltransferases in Cancer: Biology, Paradox, Aberrations, and Targeted Therapy. Cancers. 2020; 12(8).
- Gujar H, DJ Weisenberger, G Liang. The Roles of Human DNA Methyltransferases and Their Isoforms in Shaping the Epigenome. Genes. 2019; 10(2).
- Uysal F, S Ozturk. DNA Methyltransferases in Mammalian Oocytes. Results and problems in cell differentiation. 2017; 63: 211-222.
- Chen C, et al. TB tools: An Integrative Toolkit Developed for Interactive Analyses of Big Biological Data. Molecular plant. 2020; 13(8): 1194-1202.
- Yu G, et al. cluster Profiler: An R package for comparing biological themes among gene clusters. Omics: A journal of integrative biology. 2012; 16(5): 284-287.
- Wang LH, et al. Downregulation of miR‑29b targets DNMT3b to suppress cellular apoptosis and enhance proliferation in pancreatic cancer. Molecular medicine reports. 2018; 17(2): 2113-2120.
- Yang H, et al. Tumor development is associated with decrease of TET gene expression and 5-methylcytosine hydroxylation. Oncogene. 2013; 32(5): 663-669.
- Tavakolian S, H Goudarzi, E Faghihloo. E-cadherin, Snail, ZEB-1, DNMT1, DNMT3A and DNMT3B expression in normal and breast cancer tissues. Acta biochimica Polonica. 2019; 66(4): 409-414.
- Singal R, et al. Polymorphisms in the DNA methyltransferase 3b gene and prostate cancer risk. Oncology reports. 2005; 14(2): 569-573.
- Afgar A, et al. MiR-339 and especially miR-766 reactivate the expression of tumor suppressor genes in colorectal cancer cell lines through DNA methyltransferase 3B gene inhibition. Cancer biology & therapy. 2016; 17(11): 1126-1138.
- Kiehl S, et al. Epigenetic silencing of downstream genes mediated by tandem orientation in lung cancer. Scientific reports. 2017; 7(1): 3896.
- He M, et al. Expression of DNMTs and MBD2 in GIST. Biomedical reports. 2013; 1(2): 223-227
- Cypris O, T Božić, W Wagner. Chicken or Egg: Is Clonal Hematopoiesis Primarily Caused by Genetic or Epigenetic Aberrations? Frontiers in genetics. 2019; 10: 785.
- Han M, et al. Epigenetic Enzyme Mutations: Role in Tumorigenesis and Molecular Inhibitors. Frontiers in oncology. 2019; 9: 194.
- Wang D, et al. Increased 5-hydroxymethylcytosine and Ten-eleven Translocation Protein Expression in Ultraviolet B-irradiated HaCaT Cells. Chinese medical journal. 2017; 130(5): 594-599.
- Delhommeau F, et al. Mutation in TET2 in myeloid cancers. The New England journal of medicine. 2009; 360(22): 2289-2301.
- Ko M, et al. Ten-Eleven-Translocation 2 (TET2) negatively regulates homeostasis and differentiation of hematopoietic stem cells in mice. Proceedings of the National Academy of Sciences of the United States of America. 2011; 108(35): 14566-14571.
- Quivoron C, et al. TET2 inactivation results in pleiotropic hematopoietic abnormalities in mouse and is a recurrent event during human lymphomagenesis. Cancer cell. 2011; 20(1): 25-38.
- Moran-Crusio K, et al. Tet2 loss leads to increased hematopoietic stem cell self-renewal and myeloid transformation. Cancer cell. 2011; 20(1): 11-24.
- Dawson MA, T Kouzarides. Cancer epigenetics: from mechanism to therapy. Cell. 2012; 150(1): 12-27.
- Seshagiri S, et al. Recurrent R-spondin fusions in colon cancer. Nature. 2012; 488(7413): 660-664.
- Sato, Y, et al. Integrated molecular analysis of clear-cell renal cell carcinoma. Nature genetics. 2013; 45(8): 860-867.
- Zhang Q, et al. Integrative Analysis of Hypoxia-Associated Signature in Pan-Cancer. iScience. 2020; 23(9): 101460.
- Lian H, WB Li, WL Jin. The emerging insights into catalytic or non-catalytic roles of TET proteins in tumors and neural development. Oncotarget. 2016; 7(39): 64512-64525.
- D’Aniello C, et al. Vitamin C in Stem Cell Biology: Impact on Extracellular Matrix Homeostasis and Epigenetics. Stem cells international. 2017; 2017: 8936156.
- Pang AW, et al. Towards a comprehensive structural variation map of an individual human genome. Genome biology. 2010; 11(5): R52.
- Zack TI, et al. Pan-cancer patterns of somatic copy number alteration. Nature genetics. 2013; 45(10): 1134-1140.
- Lynch M. Genomics. Gene duplication and evolution. Science (New York, N.Y.). 2002; 297(5583): 945-947.
- Yen RW, et al. Isolation and characterization of the cDNA encoding human DNA methyltransferase. Nucleic acids research. 1992; 20(9): 2287-2291.
- Li Y, et al. Stella safeguards the oocyte methylome by preventing de novo methylation mediated by DNMT1. Nature. 2018; 564(7734): 136-140.
- Kobayashi H, et al. Contribution of intragenic DNA methylation in mouse gametic DNA methylomes to establish oocyte-specific heritable marks. PLoS genetics. 2012; 8(1): e1002440.
- Inoue A, Y Zhang. Replication-dependent loss of 5-hydroxymethylcytosine in mouse preimplantation embryos. Science (New York, N.Y.). 2011; 334(6053): 194.
- Yang R, et al. Hydrogen Sulfide Promotes Tet1- and Tet2-Mediated Foxp3 Demethylation to Drive Regulatory T Cell Differentiation and Maintain Immune Homeostasis. Immunity. 2015; 43(2): 251-263.
- Yue X, et al. Loss of TET2 and TET3 in regulatory T cells unleashes effector function. Nature communications. 2019; 10(1): 2011.
- Ichiyama K, et al. The methylcytosine dioxygenase Tet2 promotes DNA demethylation and activation of cytokine gene expression in T cells. Immunity. 2015; 42(4): 613-626.
- Tian Z, et al. TRIM8 inhibits breast cancer proliferation by regulating estrogen signaling. American journal of cancer research. 2020; 10(10): 3440-3457.
- Chen Z, et al. DNA methylation markers that correlate with occult lymph node metastases of non-small cell lung cancer and a preliminary prediction model. Translational lung cancer research. 2020; 9(2): 280-287.
- Hamid AA, et al. Expression of cold-inducible RNA-binding protein in the normal endometrium, endometrial hyperplasia, and endometrial carcinoma. International journal of gynecological pathology: Official journal of the International Society of Gynecological Pathologists. 2003; 22(3): 240-247.
- Shang C, et al. The Prognostic Value of DNA Methylation, Post-Translational Modifications and Correlated with Immune Infiltrates in Gynecologic Cancers. Pharmacogenomics and personalized medicine. 2021; 14: 39-53.
- Huang R, et al. The Construction of Bone Metastasis-Specific Prognostic Model and Co-expressed Network of Alternative Splicing in Breast Cancer. Frontiers in cell and developmental biology. 2020; 8: 790.
- Indacochea A, et al. Cold-inducible RNA binding protein promotes breast cancer cell malignancy by regulating Cystatin C levels. RNA (New York, N.Y.). 2021; 27(2): 190-201.
- Su PH, et al. Epigenetic silencing of PTPRR activates MAPK signaling, promotes metastasis and serves as a biomarker of invasive cervical cancer. Oncogene. 2013; 32(1): 15-26.
- Wu X, et al. Hypermethylation of the -Activated MAPK Signaling Pathway to Promote the Development of Glioma. Cancer management and research. 2020; 12: 7043-7059.
- Fan G, et al. DNA methylation biomarkers for hepatocellular carcinoma. Cancer cell international. 2018; 18: 140.
- Lee S, J Rauch, W Kolch. Targeting MAPK Signaling in Cancer: Mechanisms of Drug Resistance and Sensitivity. International journal of molecular sciences. 2020; 21(3).
- Khaliq M, M Fallahi-Sichani. Epigenetic Mechanisms of Escape from BRAF Oncogene Dependency. Cancers. 2019; 11(10).
- Shen Y, et al. Gene mutation patterns and their prognostic impact in a cohort of 1185 patients with acute myeloid leukemia. Blood. 2011; 118(20): 5593-5603.
- Cao XY, et al. DNA methyltransferase3a expression is an independent poor prognostic indicator in gastric cancer. World journal of gastroenterology. 2014; 20(25): 8201-8208.
- Gao Q, et al. Deletion of the de novo DNA methyltransferase Dnmt3a promotes lung tumor progression. Proceedings of the National Academy of Sciences of the United States of America. 2011; 108(44): 18061-18066.
- Szablewski V, et al. An epigenetic regulator-related score (EpiScore) predicts survival in patients with diffuse large B cell lymphoma and identifies patients who may benefit from epigenetic therapy. Oncotarget. 2018; 9(27): 19079-19099.
- Patnaik MM, et al. DNMT3A mutations are associated with inferior overall and leukemia-free survival in chronic myelomonocytic leukemia. American journal of hematology. 2017; 92(1): 56-61.
- Belani R, et al. ASXL1 and DNMT3A mutation in a cytogenetically normal B3 thymoma. Oncogenesis, 2014; 3: e111.